
Figures & data
Table 1 Socio-Demographic and Clinical Characteristics of Study Participants Attending Arsi Negelle Health Center from January 1, 2014 to January 06, 2019
Table 2 A Change in CD4+ T Cell Count from the Baseline to 6 Months After HAART Initiation
Figure 1 Median CD4+ T cell change of the study participants during 60 months of HAART treatment at Arsi Negelle Health Center from January 01, 2014 to January 06, 2019.
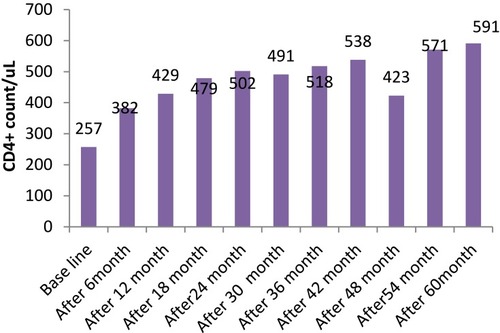
Figure 2 CD4+ T cell recovery of 195 study participants on HAART over 60 months of follow-up at Arsi Negelle Health Center from January 01, 2014 to January 06, 2019.
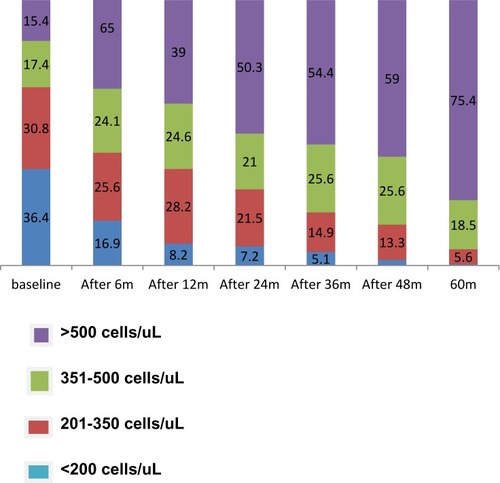
Figure 3 Median CD4+ T cell count of children less than 15 years old at Arsi Negelle Health Center from January 01, 2014 to January 06, 2019.
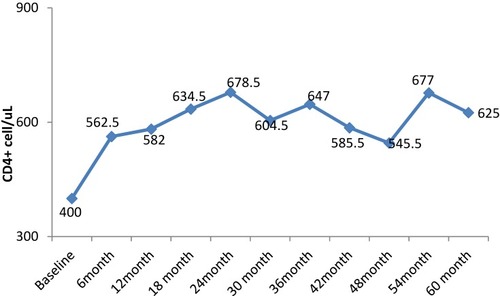
Figure 4 Immunological non-response rate of study participants from 12 to 60 months after HAART commencement at Arsi Negelle Health Center from January 01, 2014 to January 06, 2019.
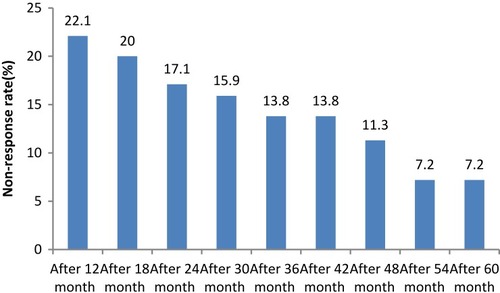
Figure 5 Nonresponse rate of the study participants aged greater than 15 years old at Arsi Negelle Health Center from January 01, 2014 to January 06, 2019.
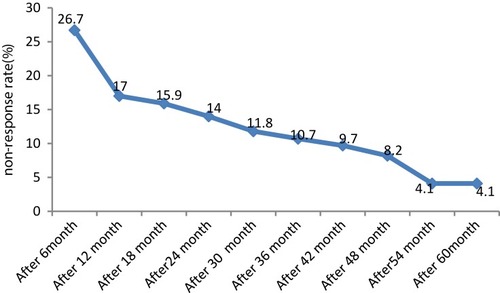
Figure 6 Immunological non response rate of children less than 15 years old at Arsi Negelle Health Center from January 01, 2014 to January 06, 2019.
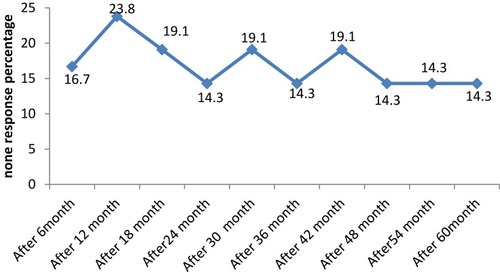
Figure 7 Contribution of children non response rate to the total immunological non-response rate at Arsi Negelle Health Center from January 01, 2014 to January 06, 2019.
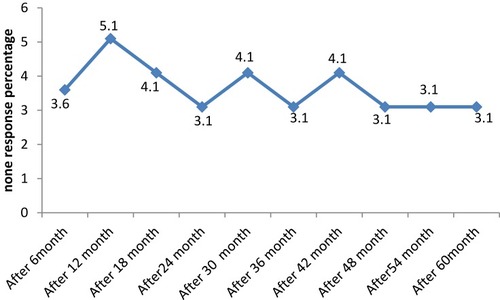
Table 3 Univariate Linear Regression for Factor Associated with a Change in CD4+ T- Cell after 60 Months of Follow-Up among HAART Experienced Study Participants at Arsi Negelle Health Center from January 01, 2014 to January 06, 2019