
Figures & data
Table 1 Key inclusion and exclusion criteria
Figure 1 Clinical trial flowchart.
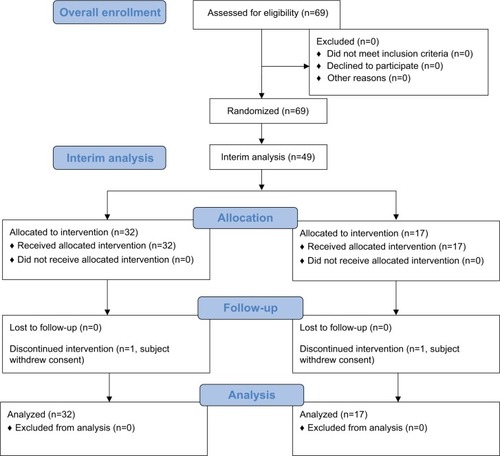
Table 2 Demographics and screening parameters
Table 3 Concomitant therapies
Figure 2 Kaplan–Meier analysis of transplant-free survival.
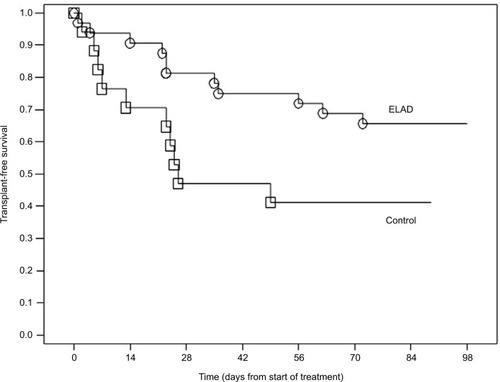
Table 4 Proportion of survivors on days 28 and 84
Table 5 Proportional hazards regression of treatment group/duration of treatment, MELD score, and food intake on transplant-free survival
Table 6 Number of subjects who died or had transplants, by food intake and MELD
Figure 3 Kaplan–Meier analysis of time to progression.
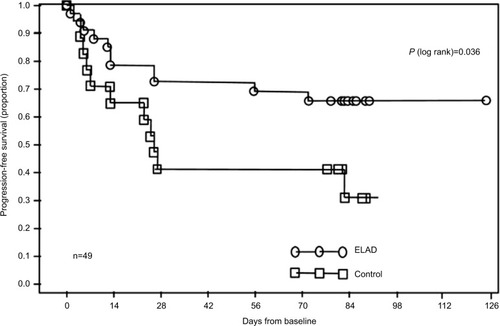
Table 7 Mean change in serum sodium concentration