Figures & data
Table 1 Baseline BP characteristics in the different patient subpopulations (based on full analysis set)
Figure 1 Treatment difference (95% confidence interval) of single-pill combination T80/H25 versus T80 on changes in mean seated trough cuff (A) systolic blood pressure and (B) diastolic blood pressure from baseline to week 7 in the different patient populations full analysis set.
Abbreviations: H25, hydrochlorothiazide 25 mg; T80, telmisartan 80 mg.
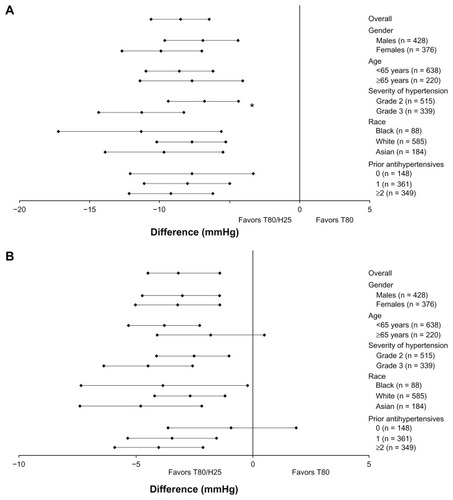
Figure 2 Odds ratios (95% confidence interval) of the single-pill combination of T80/H25 versus T80 in blood pressure goal rates. (A) Systolic blood pressure (<140 mmHg), (B) diastolic blood pressure (<90 mmHg), and (C) systolic/diastolic blood pressure control (<140/90 mmHg) at week 7 in the different patient subpopulations.
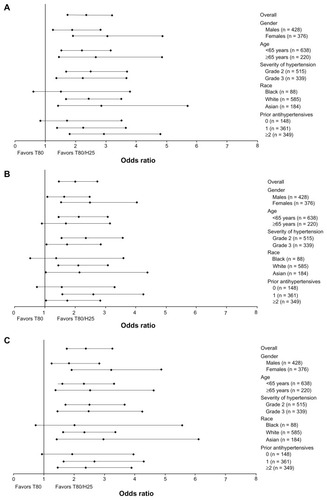
Figure 3 Odds ratios (95% confidence interval) of a single-pill combination of T80/H25 versus T80 on proportion of patients with seated trough cuff systolic blood pressure reduction (A) >30 mmHg and (B) >40 mmHg at week 7 in the different patient subpopulations.
Abbreviations: H25, hydrochlorothiazide 25 mg; T80, telmisartan 80 mg.
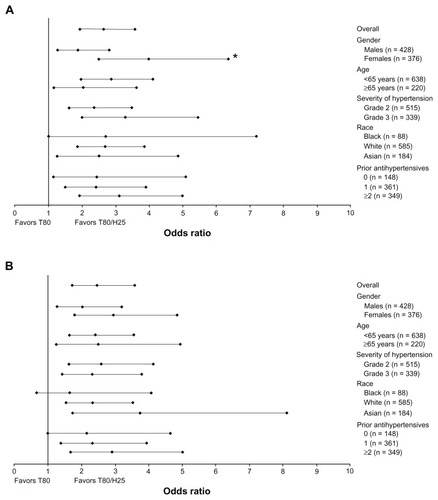
Table 2 Systolic and diastolic BP reductions (mmHg) from baseline to week 7 in overall patient population and different patient subpopulations in the full analysis set
Table 3 Summary of adverse events in the different patient subpopulations, based on treated patients
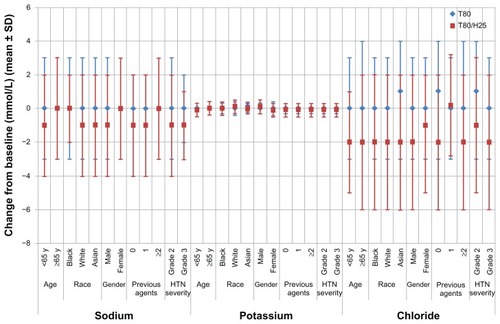
Figure 4 Mean change from baseline in electrolytes across patient subpopulations at week 7 (mean ± standard deviation).