Figures & data
Table 1 Primers for quantitative real-time polymerase chain reaction
Figure 1 Sequence results of mazF3,6,9.
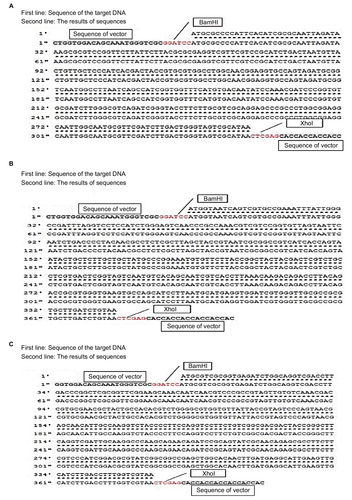
Figure 2 SDS-PAGE and Western blot analyses to facilitate detection of recombinant protein expression.
Abbreviations: SDS-PAGE, sodium dodecyl sulfate polyacrylamide-gel electrophoresis; IPTG, isopropyl β-d-1-thiogalactopyranoside; MW, molecular weight; ppt, precipitation; sup, supernatant; BSA, bovine serum albumin.
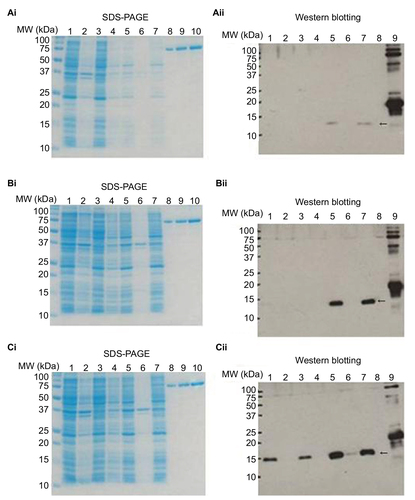
Figure 3 Growth profiles of MTB in standard, hypoxic and nutrient starvation conditions at different culture time points.
Abbreviation: MTB, Mycobacterium tuberculosis; MCF, McFarland turbidity standards.
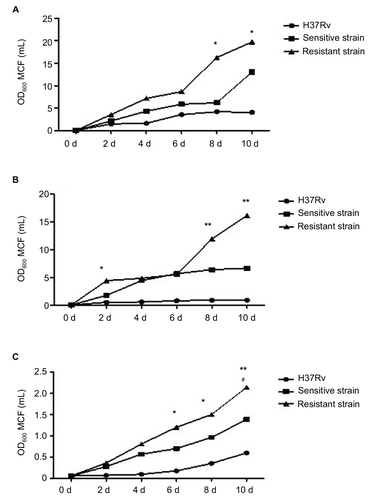
Figure 4 Biofilm-formation ability of drug-sensitive and drug-resistant MTB strains.
Abbreviation: MTB, Mycobacterium tuberculosis.
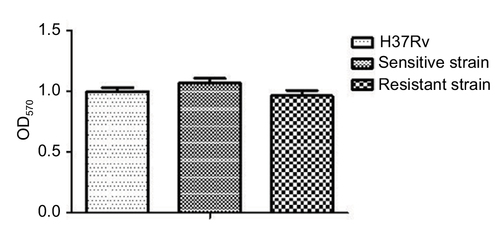
Figure 5 mRNA expression of mazE3,6,9 in drug-sensitive and drug-resistant MTB strains and the control strain H37Rv.
Abbreviation: MTB, Mycobacterium tuberculosis.
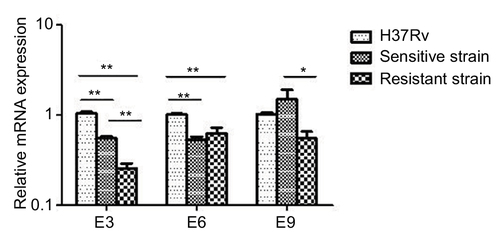
Figure 6 mazF3,6,9 mRNA expression in drug-sensitive and drug-resistant MTB strains and the control strain H37Rv.
Abbreviation: MTB, Mycobacterium tuberculosis.
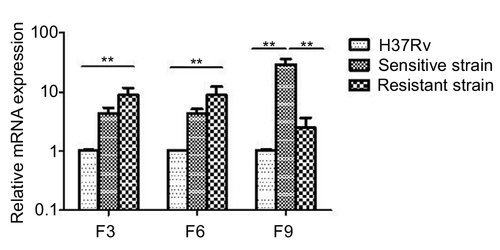
Figure 7 MazF9 protein expression in drug-sensitive and drug-resistant MTB strains.
Abbreviations: MTB, Mycobacterium tuberculosis; SS, sensitive strain; RS, resistant strain; RV, H37Rv.
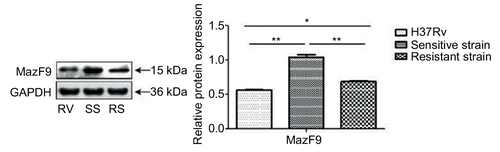
Table 2 The number of living bacteria in various conditions over time
Figure 8 Viability in parent and mazEF-deletion mutant H37Rv strains in host macrophages after infection.
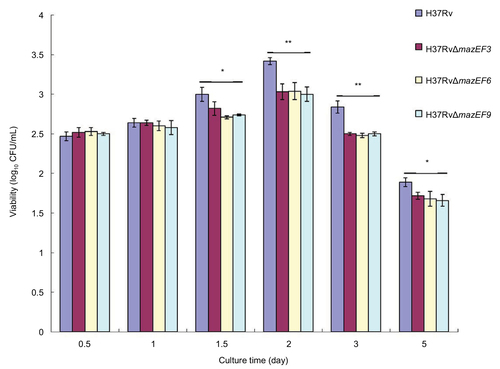
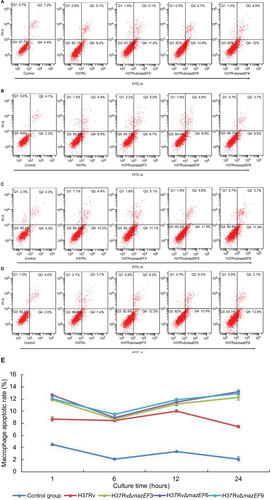
Figure 9 Host-macrophage apoptosis over time after infection with H37Rv, H37RvΔmazEF3, H37RvΔmazEF6, or H37RvΔmazEF9.
Abbreviations: FITC, fluorescein isothiocyanate; PI, propidium iodide.