Figures & data
Figure 1 Flowchart of the enrolled patients.
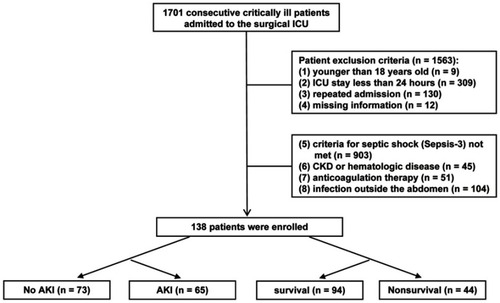
Table 1 Baseline characteristics
Table 2 Univariable analysis of baseline characteristics
Table 3 The relationship between coagulative biomarkers and AKI according to multivariable logistic regression analysis
Table 4 The AUC of coagulative biomarkers for predicting AKI after adjustment for baseline characteristics in model 1 or model 2
Figure 2 Comparison of the area under the curve (AUC) of coagulative biomarkers for predicting AKI. (A) Comparison of the AUC for APTT, PT, INR and D-dimer level after adjustment for model 1. (B) Comparison of the AUC for APTT, PT and D-dimer level after adjustment for model 2.
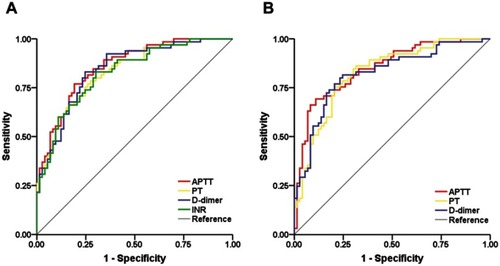
Table 5 Multivariate Cox regression analysis for 30-day mortality
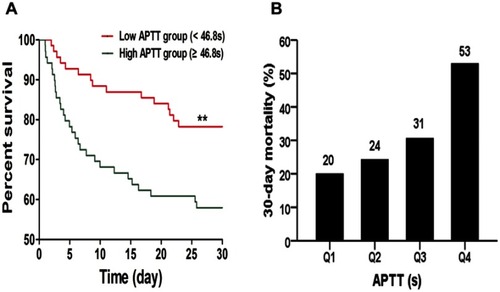
Figure 3 (A) Kaplan-Meier survival curves of 30-day mortality according to plasma APTT levels. (B) The 30-day mortality rates according to the interquartile range of plasma APTT levels. (Q1, APTT ≤39.8 s; Q2, 39.8 s < APTT ≤46.8 s; Q3, 46.8 s < APTT ≤53.3 s; Q4, APTT >53.3 s).