Figures & data

Table 1 Transcriptome Sequencing Summary for Different P. aeruginosa Strains
Figure 1 Hierarchical clustering and Volcano plot of differential expression in PA1.2620 original strain vs PA-99 mutant. (A). Hierarchical clustering. T04-T05 stands for two biological duplications of PA1.2620 strain, T09-T11 stands for three biological duplications of tachyplesin I-resistant PA-99 strain. Each column represents one sample, and each row represents one gene. The red and green gradients indicate an increase and a decrease in gene expression abundance, respectively. (B). Volcano plot. Each point in the volcano plot represents one gene, and the abscissa represents the logarithm of the expression difference fold of one gene in PA1.2620 original strain vs PA-99 mutant. This vertical axis represents the negative logarithm of the error detection rate. The green dots represent downregulated genes, the red dots represent upregulated genes and the black dots represent unchanged genes.
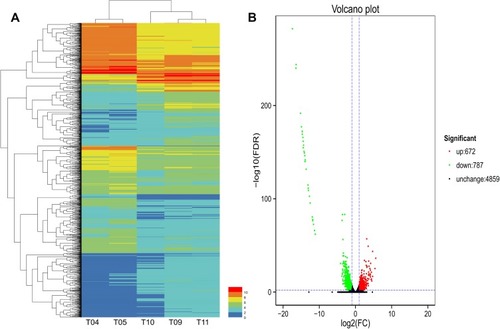
Table 2 The Numbers Statistics of Annotated DEGs
Figure 2 Functional annotation of DEGs in PA1.2620 original strain vs tachyplesin-resistant PA-99 mutant. (A). GO enrichment categorization; (B). COG classification; (C). KEEG categorization.
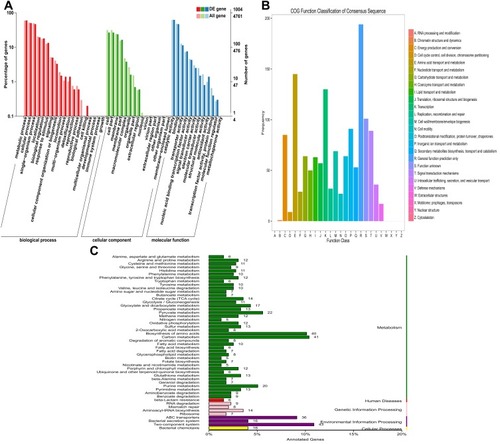
Table 3 Expression of Part Genes Related to Drug Resistance
Table 4 The Contents of OMPs from Different P. aeruginosa Strains
Figure 3 Illustrating the RT-qPCR conformation results for the 10 selected DEGs. The X-axis represents the selected 10 genes and the Y-axis represents the fold change values derived from RNA-seq and RT-qPCR.
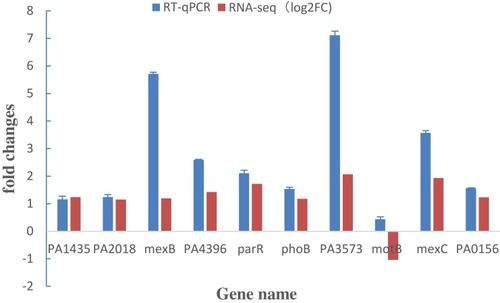
Figure 4 Outer membrane permeability of original and mutant strains.
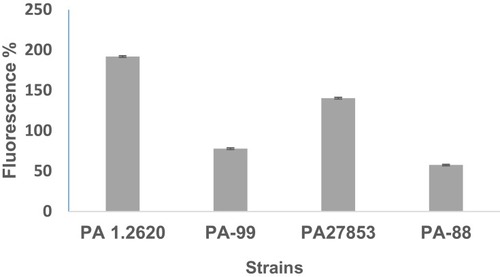
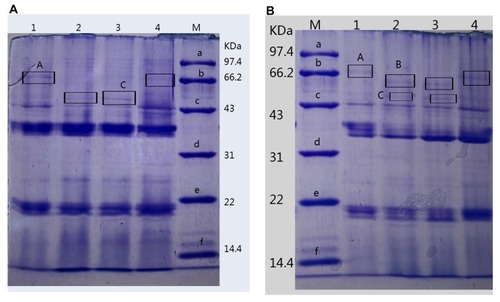
Figure 5 Analysis of OMPs of different P. aeruginosa strains. (A). 1, 4: PA1.2620; 2–3: PA-99. (B). 1, 4: PA27853; 2–3: PA-88.
Abbreviation: M, standard protein marker.