Figures & data
Table 1 Carbapenems Susceptibility of E. coli Clinical Isolates
Table 2 Patient’s Clinical Data and Characteristics of Analyzed Strains
Table 3 Minimum Inhibitory Concentrations (MICs) of 58 Carbapenem-Resistant E. coli Isolates
Figure 1 Antibiotic resistant mechanisms detected in the E. coli strains that were sequenced as part of this study. (A) Modified carbapenem inactivation method (mCIM) for phenotypic detection of carbapenemase production; (B) outer membrane porins genes; (C) carbapenem resistance genes; (D) β-lactam resistance genes; (E) carbonyl cyanide m-chlorophenylhydrazone (CCCP) was used to measure the activity of efflux pumps in carbapenem-resistant E. coli isolates. Black squares represent positive, gray squares represent negative.
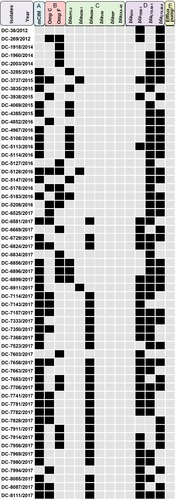
Table 4 Mutations in Carbapenem-Resistant E. coli Isolates
Table 5 Analysis of Mutations in ompC and ompF
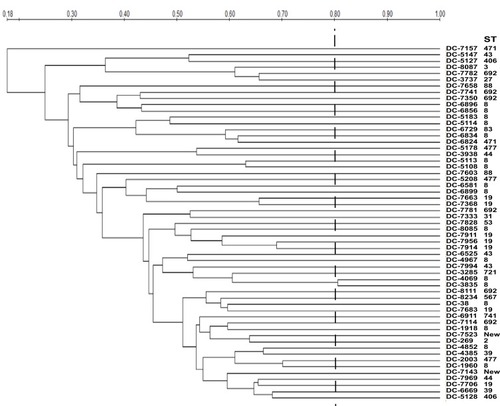
Figure 2 PFGE profiles of Xba I-digested chromosomal DNAs of carbapenem-resistant E. coli isolates. Relatedness was analyzed using QualityOne software (Bio-Rad Laboratories, USA). The phylogenetic tree was generated using UPGMA clustering. A genetic similarity index scale is indicated by the vertical line.