Figures & data
Table 1 Bacterial Strains and Plasmids Used in This Study
Table 2 Primers Used in This Study
Figure 1 Plasmid map of pCas9-m1/m2 targeted to mcr-1 gene. The pCas9-m1/m2 was constructed by inserting spacer targeting the mcr-1 gene along with other essential modules for CRISPR-Cas9 activity.
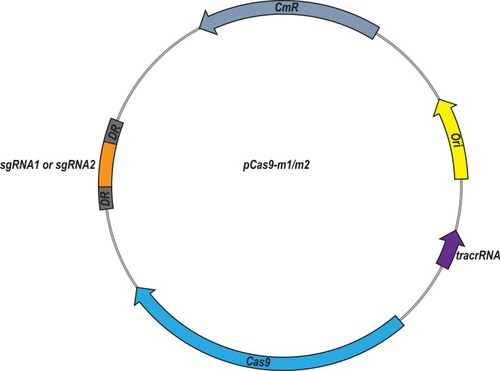
Figure 2 (A) Confirmation of mcr-1 gene presence in E. coli C600+pHNSHP45 by PCR amplification with primer mcr-1-JD-F/R. The M means 2000bp marker. The + lane is a C600+pHNSHP45 strain transformed with pCas9 as positive control. The other lanes mean C600+pHNSHP45 strain transformed with pCas9-m1 (B) Confirmation of mcr-1 gene elimination in C600+pUC19-mcr-1 by PCR amplification with primer mcr-1-JD-F/R.
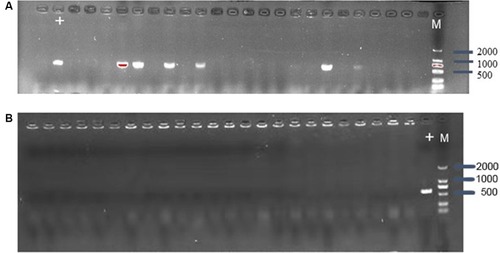
Figure 3 The relative copy number of plasmid pUC19-mcr-1 at each time point. pCas9-m1 and pCas9-m2 transformed into competent E. coli C600+pUC19-mcr-1 serve as experimental groups. Plasmid pCas9 transformed into competent E. coli C600+pUC19-mcr-1 is control group. The bars represent mean value of three biological replicates with error-bars showing standard deviation.
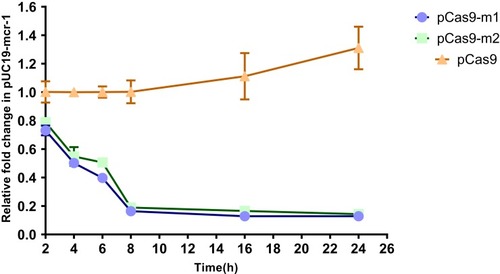
Figure 4 E. coli strain C600 harboring pCas9-m-1 limited the conjugation of pHNSHP45. Colistin-resistant E. coli C600+ pHNSHP45 as donor and E. coli C600, chloramphenicol-resistant, E. coli C600+pCas9-m1 or C600+pCas9 as the recipient strain. Double asterisk indicates statistical significance with P< 0.01 in Student’s t-test, compared to the results from E. coli C600+pCas9-m1. The bars represent mean value of three biological replicates with error-bars showing standard deviation.
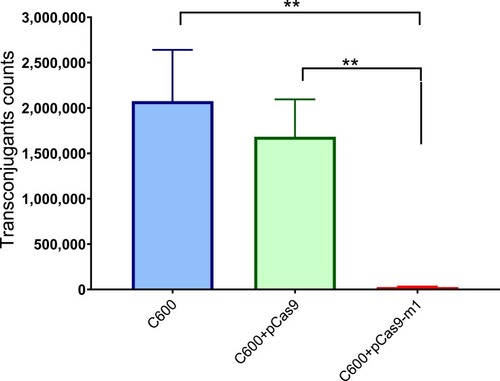
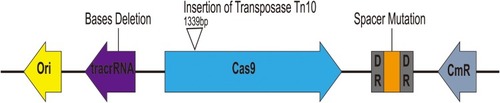
Figure 5 Characterization of escape mutants that tolerated transformation of pCas9-m1 construct. Spacer mutations in the CRISPR locus, deletions in tracrRNA and transposon insertions in cas9 led to pCas9-m1 inactivation in successful transformants.