Figures & data
Table 1 Demographic and Baseline Characteristics of Patients
Table 2 Univariate and Multivariate Analyses of Associations Between the HBV RNA Level and HBeAg Seroconversion at Week 96
Figure 1 Serum level of HBV RNA at indicated time points: (A) Comparison of the serum HBV RNA level between the HBeAg-seroconversion group and non-HBeAg-seroconversion group. (B) Comparison of the serum HBV RNA level between the virologic response (VR) group and non-virologic response (NVR) group. Data are the mean ± SEM, and determined by the Mann–Whitney U-test. *p < 0.05, ***p < 0.001.
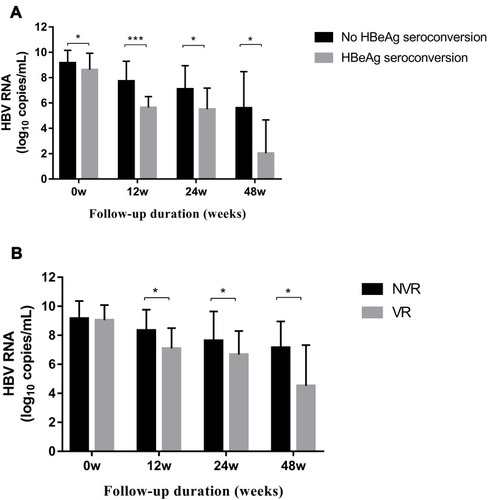
Figure 2 Analyses of receiver operating characteristic (ROC) curves of the sensitivity and specificity of the serum HBV RNA level at week 12 for the prediction of HBeAg seroconversion and the virologic response (VR).
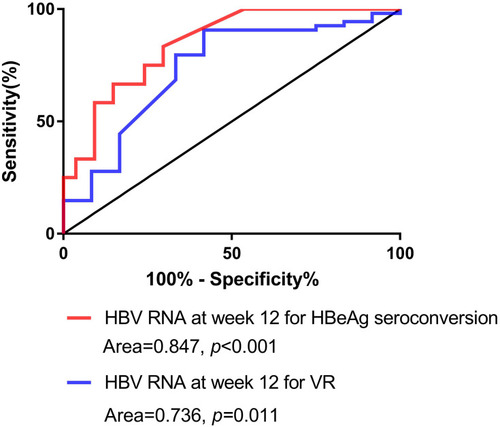
Figure 3 Probability of HBeAg seroconversion based on the serum HBV RNA level at week 12.
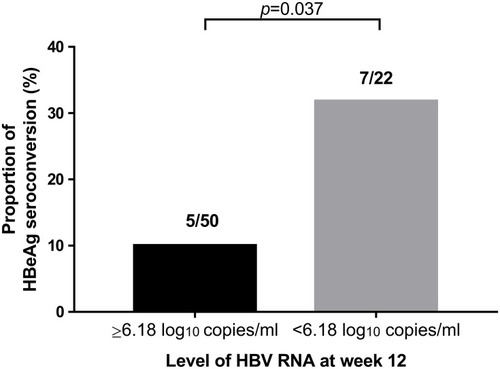
Table 3 Univariate and Multivariate Analyses of Associations Between the HBV RNA Level and Virologic Response at Week 96
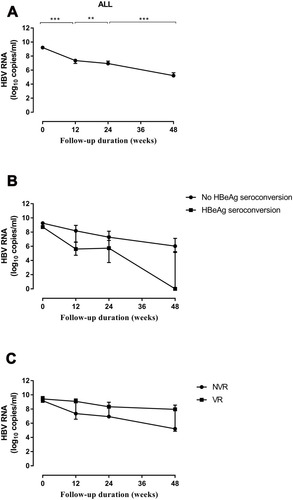
Figure 4 Dynamic changes in the HBV RNA level during NA therapy. (A) Trend in the total RNA level. (B) Grouping was based on whether HBeAg seroconversion occurred at week 96. (C) Grouping was based on whether a VR occurred at week 96. Data are the median value, and determined by the Mann–Whitney U-test. **p < 0.01, ***p < 0.001.