Figures & data
Figure 1 Volcano plot showing log2 fold change plotted against -log10 adjusted P value for ESBLs+ Klebsiella pneumoniae samples versus non-ESBL Klebsiella pneumoniae samples. Data points in the upper right (fold change > 1.2) and upper left (fold change < 0.83) sections with P<0.05 represent proteins that are significantly different in ESBLs+ Klebsiella pneumoniae compared with non-ESBL Klebsiella pneumoniae.
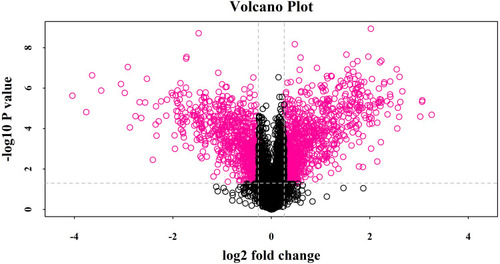
Figure 2 Gene Ontology (GO) classification of differentially expressed proteins by iTRAQ-based proteomics experiments between ESBLs+ Klebsiella pneumoniae and non-ESBL Klebsiella pneumoniae. The differentially expressed proteins are grouped into three GO terms: biological process, cellular component, and molecular function. The y-axis indicates the number and percent of proteins in each GO term.
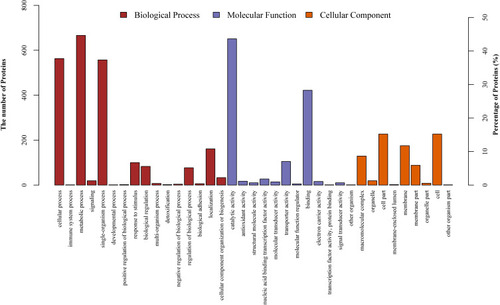
Figure 3 Differentially expressed proteins were combined to build a regulatory network by STRING. The differentially expressed proteins are represented as nodes, and the relationship between two nodes is represented as an edge. The empty nodes represent the proteins of unknown 3D structure, while the filled nodes indicate that some 3D structure is known or predicted. The interaction information between proteins from curated databases is represented by an blue edge; experimentally determined: purple edge; predicted interactions: cyan edge; and textming: lawn green edge. The network contained 90 nodes and 115 edges with an average node degree of 2.56 and a clustering coefficient of 0.421. The PPI enrichment p-value was equal to 8.58e-07.
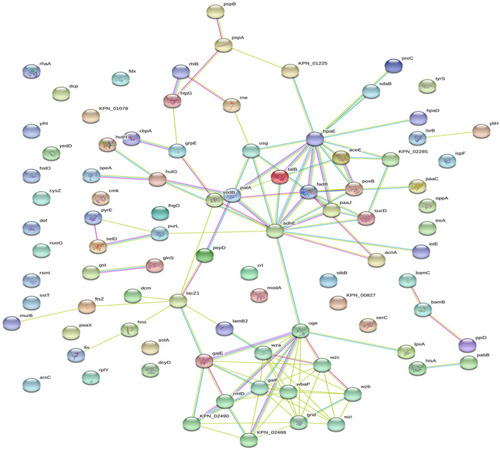
Table 1 Top 9 Proteins Potential to Be Anti-Virulence Targets in ESBL-Producing Klebsiella pneumoniae
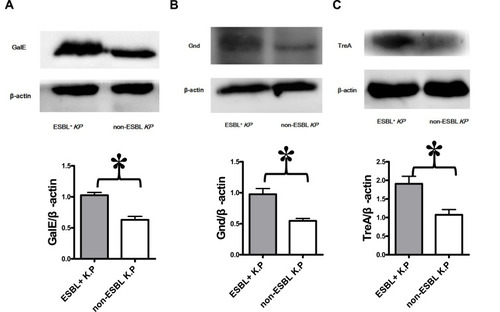
Figure 4 Validation of proteomics data by Western blot. The sediments of every 10 isolates of ESBLs+ Klebsiella pneumoniae or non-ESBL Klebsiella pneumoniae were mixed as one group of samples. The protein from each group was analyzed for treA, galE and Gnd levels by Western blot. The blots were reprobed with β-actin antibody to confirm equal loading of the samples. Representative Western blot images from three independent experiments for Gale (A), Gnd (B), and TreA (C) levels with β-actin as a loading control are shown. The expression levels of Gale (A), Gnd (B) and TreA (C) are higher in ESBLs+ Klebsiella pneumoniae group. *P<0.05.