Figures & data
Table 1 Oligonucleotide Sequences Used in This Study
Figure 1 Analysis of 101 sequenced P. aeruginosa genomes. A maximum-likelihood tree and MLST analysis, presence of beta-lactamases, and enzymes.
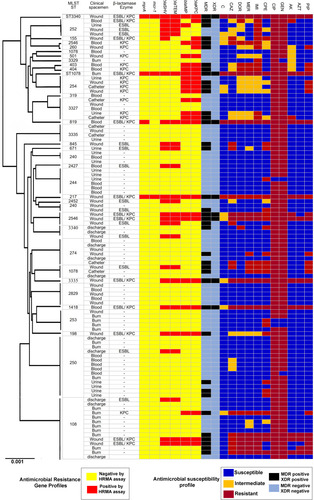
Figure 2 The qPCR dilution series for analytical sensitivity of real-time PCR for mcr-1, blaTEM, and blaSHV genes in clinical isolates of P. aeruginosa. The melting profiles of mcr-1, blaTEM, and blaSHV genes showed (i) Figures. The Ct value of different dilutions was shown in (ii) Figures. The primer efficiency slope and standard curves of mcr-1, blaTEM, and blaSHV genes are shown in (iii) Figures. The melting temperature profile was as follows: 83±0.5°C for blaSHV gene, 82.5±0.5°C for blaTEM gene, and 90.0± 0.5°C for mcr-1 gene. Also, the efficiency of the primer was 98.19% for the blaSHV gene, 99.97% for the blaTEM gene, and 97.01% for the mcr-1 gene. For evaluation of the sensitivity of the real-time PCR assays, a series of five-fold diluted DNA of the positive controls were initially tested on the ABI Step-One Plus system. The mean of a: 100,000 ng; b: 10,000 ng; c: 1000 ng; d: 100 ng; e: 10 ng of DNA dilutions. Horizontal lines represent the cycle threshold of real-time PCR. The melting and slope temperature profile were as follows: 83.2±0.5°C for blaKPC gene, 80.6±0.5°C for blaIMP gene, 83±0.5°C for blaSHV gene, 82.5±0.5°C for blaTEM gene, 91.7±0.5°C for pmrA gene, and 90.0± 0.5°C for mcr-1 gene.
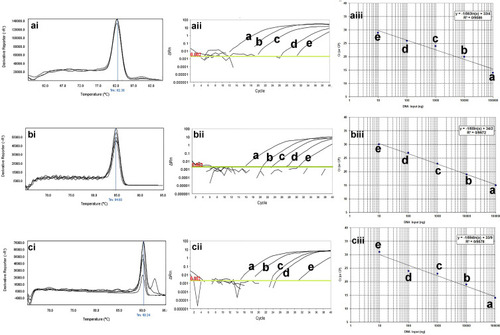
Figure 3 The qPCR dilution series for analytical sensitivity of real-time PCR for blaIMP, blaKPC, and mprA genes in clinical isolates of P. aeruginosa. The melting profiles of blaIMP, blaKPC, and mprA genes showed (i) Figures. The Ct value of different dilutions was shown in (ii) Figures. The primer efficiency slope and standard curves of blaIMP, blaKPC, and mprA genes are shown in (iii) Figures. The melting temperature profile was as follows: 83.2±0.5°C for blaKPC gene, 80.6±0.5°C for blaIMP gene, and 91.7±0.5°C for pmrA gene. Also, the efficiency of the primer was 99.31% for the blaKPC gene, 97.99% for the blaIMP gene, and 98.12% for the mprA gene. For evaluation of the sensitivity of the real-time PCR assays, a series of five-fold diluted DNA of the positive controls were initially tested on the ABI Step-One Plus system. The mean of a: 100,000 ng; b: 10,000 ng; c: 1000 ng; d: 100 ng; e: 10 ng of DNA dilutions. Horizontal lines represent the cycle threshold of real-time PCR.
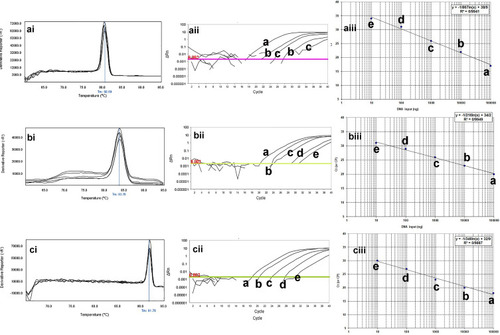
Figure 4 The specificity of real-time PCR for primers used to detect of CRPA and β-lactamase producing P. aeruginosa. Melting curve analysis showing the melting temperature peaks (Tm) of blaIMP (bi), blaKPC(ci), mprA(di), blaTEM(bii), blaSHV(cvi), and mcr-1(dii). ai: Staphylococcus aureus ATCC25923.
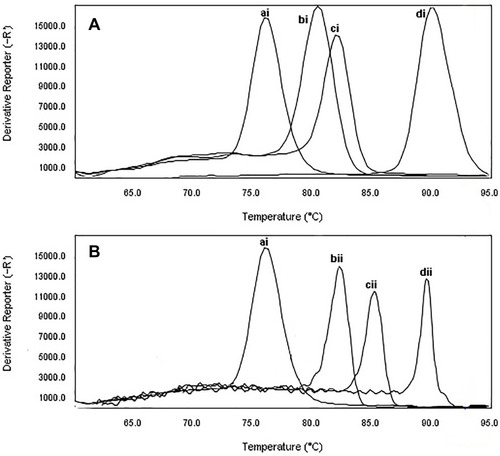
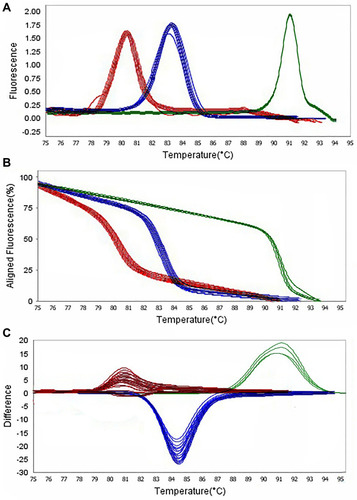
Figure 5 Representative high resolution melting graphs corresponding to one high resolution melting analysis of MDR and XDR strains of P. aeruginosa (n = 39). Curves of tested samples identified as blaIMP carrier are shown in red, blaKPC carrier are shown in blue, and mprA carrier are shown in green. β-lactamases genes were amplified successfully using the EvaGreen Dye in the ABI Step-OnePlus machine by one-sept protocol. (A) Melting curves; (B) Normalized plot; and (C) Difference plot. Positive control: P. aeruginosa NCTC 13,359.
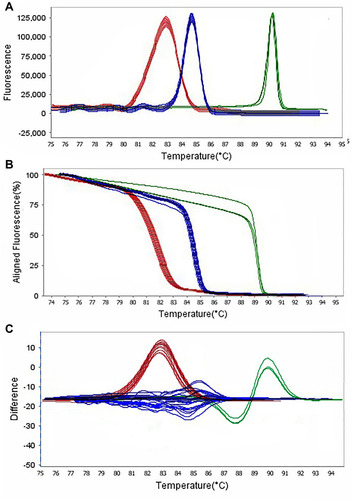
Table 2 Analysis of Variables Significantly Associated STs, Antimicrobial Resistance and Clinical Samples in Clinical Isolates of P. aeruginosa
Figure 6 Representative high resolution melting graphs corresponding to one high resolution melting analysis of MDR and XDR strains of P. aeruginosa (n = 39). Curves of tested samples identified as blaTEM carrier are shown in red, blaSHV carrier are shown in blue, and mcr-1 carrier are shown in green. β-lactamases genes were amplified successfully using the EvaGreen Dye in the ABI Step-OnePlus machine by one-sept protocol. (A) Melting curves; (B) Normalized plot; and (C) Difference plot. Positive control: P. aeruginosa NCTC 13,359.