Figures & data
Table 1 List of Primers Used in the Current Study
Table 2 Relationship Between Different Carbapenemases and β-Lactamases Among the Klebsiella pneumoniae Isolates and Patient’s Clinical Data
Figure 1 Frequencies of the antimicrobial resistance among the carbapenem-resistant K. pneumoniae isolates. A bar graph presenting the percentages of the resistance to 14 different antibiotics among the 52 carbapenem-resistant K. pneumoniae. The chart was generated using GraphPad Prism v5.
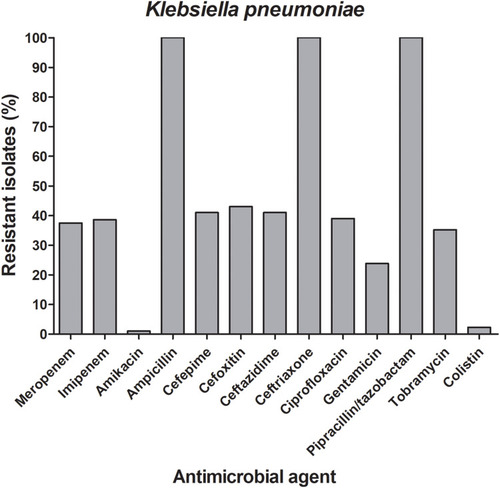
Figure 2 Distribution of carbapenemases and ESBLs encoding genes among the carbapenem-resistant K. pneumoniae isolates A bar graph showing the percentages of carbapenem-resistant K. pneumoniae isolates (n=52) harboring genes encoding carbapenemases (blaOXA-48, blaNDM, blaVIM, and blaIMP) and ESBLs (blaCTX-M, blaTEM, and blaSHV) either in combination (grey bars) or as single genes (white bars).
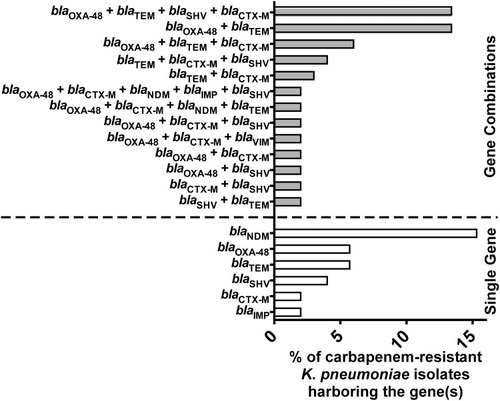
Figure 3 ERIC-PCR profiles of carbapenem-resistant K. pneumoniae harboring the blaOXA-48 gene A dendrogram was generated from the ERIC-PCR typing of 30 K. pneumoniae clinical isolates. The analysis was performed using BioNumerics fingerprint data software v7.62 and the unweighted pair group method with arithmetic means (UPGMA) clustering method and the dice similarity coefficient with 1% optimization and 1.5% position tolerance. The different clusters are designated by Roman numerals (I–III). The numbers written on the branches indicate the similarity percentage of the different isolates. On the right side of the dendrogram detailed results including the number of each isolate, clusters, date of isolation, and hospital wards. The alphabets indicate the type of the hospital wards; a: hematology ward, b: solid tumor ward c: surgery ward.
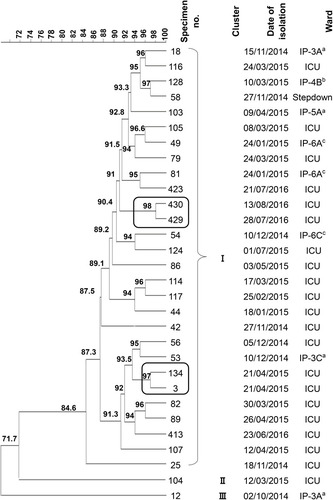
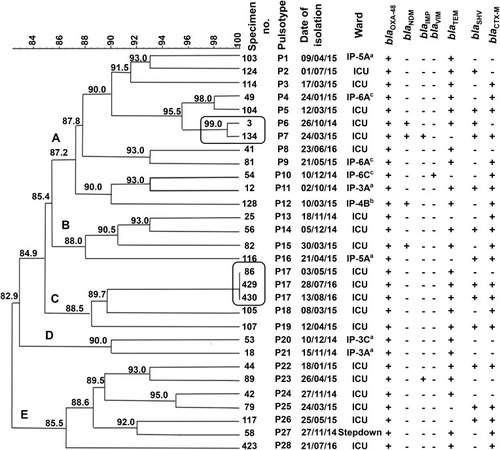
Figure 4 PFGE typing of the blaOXA-48-harbouring carbapenem-resistant K. pneumoniae isolates A dendrogram was generated from the PFGE patterns of XbaI digested chromosomal DNA of 30 carbapenem-resistant K. pneumoniae clinical isolates. The comparison was performed with the BioNumerics fingerprint data software v7.62 using the UPGMA clustering method and the dice similarity coefficient with 1% optimization and 1.5% position tolerance. PFGE pulsotypes (P) were assigned to isolates according to Tenover criteria.Citation27 The numbers written on the branches indicate the similarity percentage of the different pulsotypes. The black frame indicates the isolates that were indistinguishable and assumed to be the same clone. The different clusters are designated by letters (A–E). On the right side of the dendrogram detailed results for PFGE including the code of each isolate, pulsotypes, date of isolation, hospital wards, and screened carbapenemases and ESBLs determinants (blaOXA-48, blaNDM, blaIMP, blaVIM, blaCTX-M, blaTEM, and blaSHV). The (+) and (-) signs indicate present and absent, respectively. The alphabets indicate the type of the hospital wards; a: hematology ward, b: solid tumor ward c: surgery ward.