
Figures & data
Figure 1 The map of Ghana showing the two study sites (black dot) within different ecological zones: Begoro in the forest area and Cape Coast in the coastal savanna area.
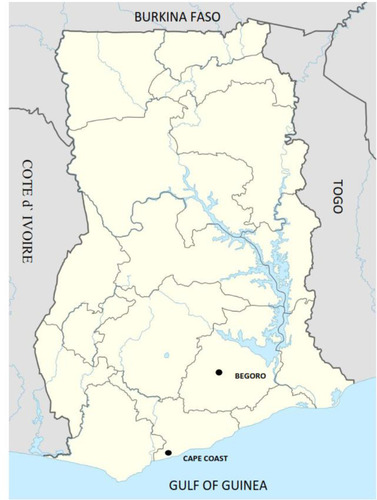
Table 1 Ex vivo Susceptibility of Plasmodium falciparum Isolates Against Selected Antimalarial Drugs
Figure 2 Distribution of GM IC50 values of chloroquine (CQ), amodiaquine (AMD), dihydroartemisinin (DHA), artesunate (ART) and mefloquine (MFQ) against P. falciparum parasites collected from Cape Coast and Begoro. The dot and square in CQ panel indicate single IC50 value outliers for Begoro and Cape Coast, respectively.
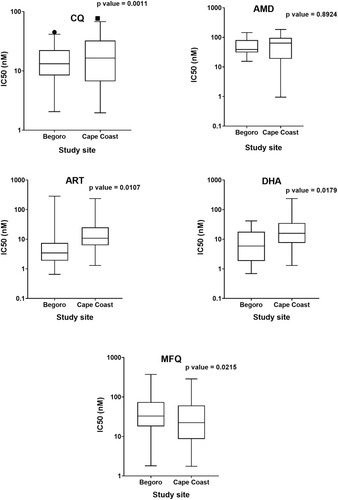
Figure 3 Distribution of GMIC50 values of Plasmodium falciparum in vitro susceptibility against selected antimalarial drugs. The green dots represent individual IC50 value of each parasite isolate and the horizontal lines represent the geometric mean of IC50 and the 95% confidence intervals (CI).
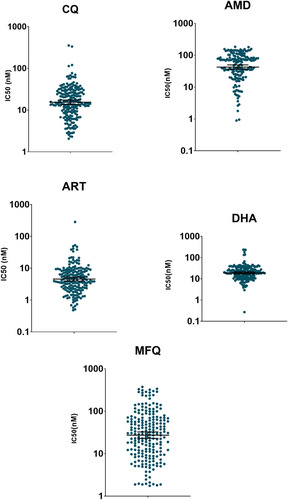
Table 2 Pairwise Correlation of ex vivo GMIC50 Values for Test Drugs