Figures & data
Figure 1 Antibiotic resistance profile of all tested E. coli isolates.
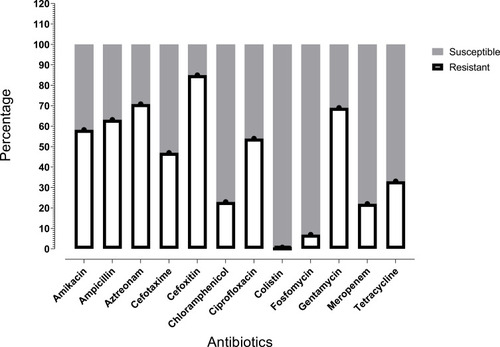
Table 1 Antimicrobial Susceptibility Profile of mcr-1 Harbored Isolates
Table 2 Prevalence of Solo or in Co-Existence of Antibiotic Resistance Genes Detected in This Study
Figure 2 Minimum spinning tree of mcr-1, blaKPC-2, and blaNDM-1 harboring E. coli by MLST type and alleles. Each node represent a sequence type, size of node represent the number of isolates, length of branches represent number of different alleles out of seven MLST alleles. Nodes are labeled with corresponding sequence type.
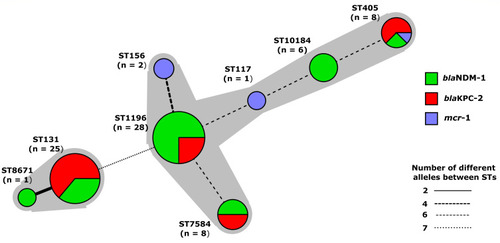
Table 3 Number of mcr-1, blaKPC-2, and blaNDM-1 Harboring Plasmids Incompatibility Type Prevalent on Various Sequence Types
Figure 3 S1 PFGE and Southern blot of mcr-1 harboring strains. H9812 is a molecular size marker (1135 to 20.5-kb). PKE211, PKE196, and PKE14, PKE051 are the isolates; digested with S1 enzymes. All isolates show 60-kb plasmid. The red arrows represent plasmids on PFGE gel. Black arrows represent plasmids on nylon membrane.
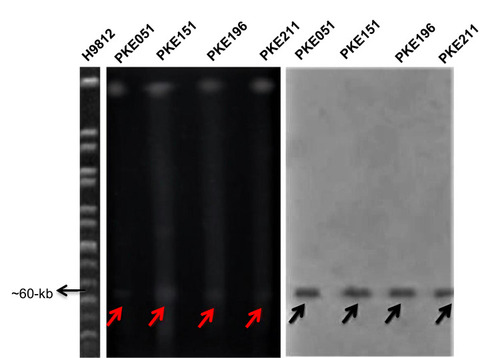
Figure 4 S1 PFGE and Southern blot of blaKPC-2 harboring strains. H9812 is a molecular size marker. PKE003 and PKE091 isolates have 90-kb plasmid, PKE201 isolate has 140-kb plasmid, and PKE470 and PKE482 isolates have 100-kb plasmid. The red arrows represent plasmids on PFGE gel. Black arrows represent plasmids on nylon membrane.
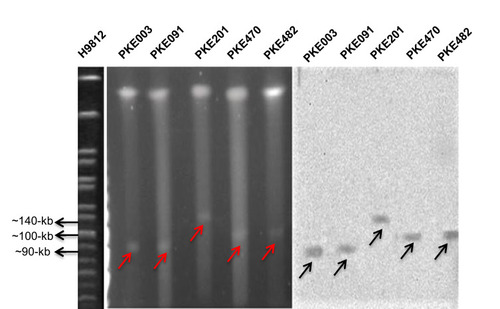
Figure 5 S1 PFGE and Southern blot of blaNDM-1 harboring strains. H9812 is a molecular size marker. PKE470 isolate have 100-kb plasmid, PKE131 isolate have 70-kb plasmid, PKE134 isolate have 45-kb plasmid, PKE263 isolate have 140-kb plasmid, and PKE303 isolate have 60-kb plasmid. The red arrows represent plasmids on PFGE gel. Black arrows represent plasmids on nylon membrane.
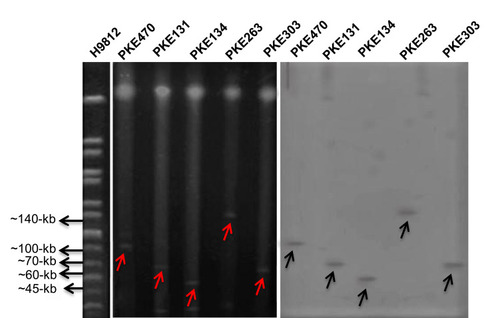
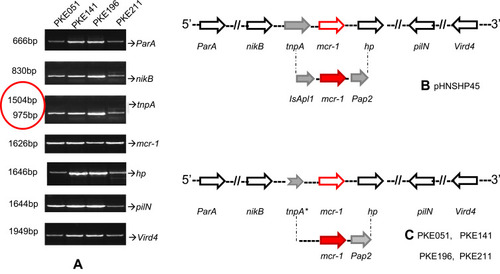
Figure 6 PCR mapping of mcr-1 genetic background. (A) PCR amplified vird4, pilN, hp, ParA, mcr-1, tnpA, and nikB, and tnpA genes, red circle show the shortened band of tnpA. (B) pHNSPH45 reference map, indicating Pap2 on downstream of mcr-1 and IsApl1 on upstream and. (C) mcr-1 genetic setting in our strains, IsApl1 is missing due to truncated tnpA. The black, red, and grey arrows represent particular genes having a name written underneath of each arrow. (*) on tnpA indicates truncation in tnpA gene.