Figures & data
Figure 1 Effects of different concentrations of rifapentine on the proliferation curve of BMSCs.
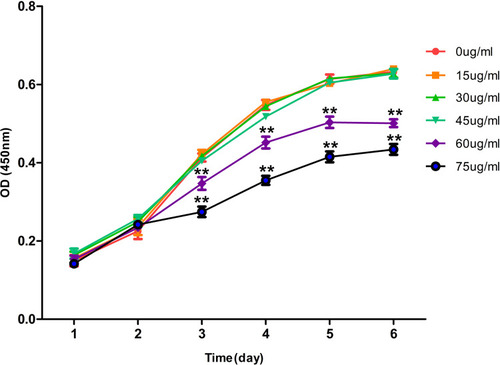
Figure 2 The properties of RPSMs in vitro and the growth of the BMSCs in the RPSMs complex.
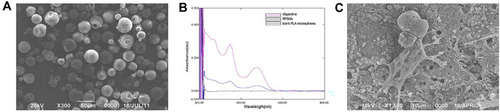
Figure 3 (A) In vitro rifapentine release curve. (B) In vitro cumulative percentage release curve of rifapentine.
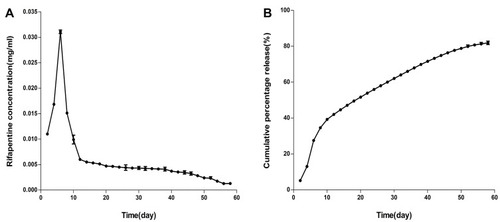
Figure 4 The effects of drugs on osteogenic differentiation of BMSCs were conducted by the Alizarin Red and ALP staining after 21 days of culture.
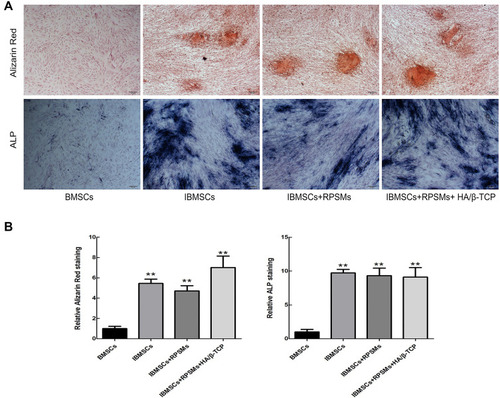
Figure 5 Effects of complex on osteogenic marker collagen I and osteocalcin of four groups of cells were analyzed by Real-time PCR and Western blot in vitro.
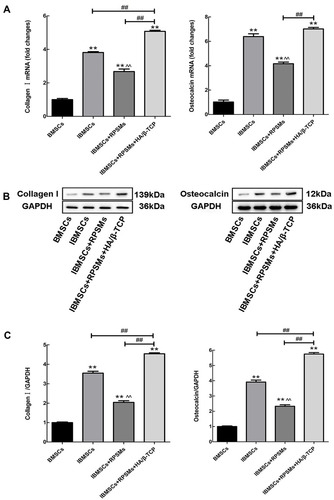
Table 1 Serological Biochemical Markers in the Complex Group at Different Time Points (Mean ± SD, n=6)
Figure 6 The changes of serum ESR (A) and CRP (B) in each group at different time were observed.
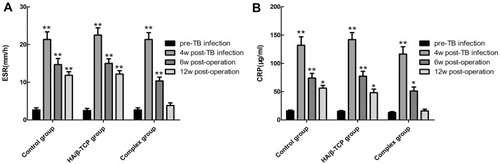
Figure 7 Macroscopic observations of the vertebral body defect healing in the three groups at 6 weeks (A–C) and 12 weeks (D–F) after surgery. The white arrow of picture is pointing to the spine defect area.
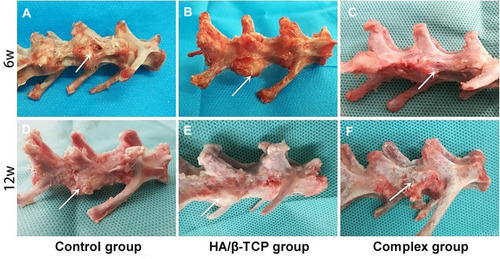
Figure 8 The images of osteocalcin immunohistochemical staining from three groups at 6 weeks (A–C) and 12 weeks (D–F) after surgery (40× magnification, scale bar =200 μm). The white arrow of picture is pointing to the surface of the spine defect area.
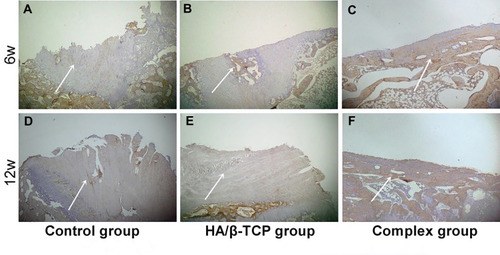
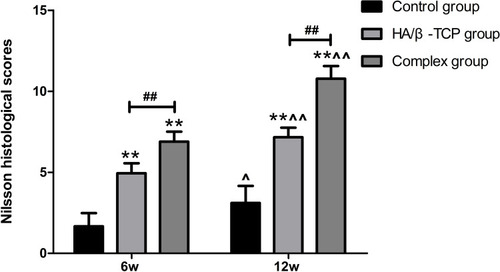
Figure 9 Nilsson histological scores for the samples from the three groups at 6 and 12 weeks after surgery (n=6).