Figures & data
Figure 1 Inhibition of in vivo MRSA activity via administration of geraniol by intramuscular route.
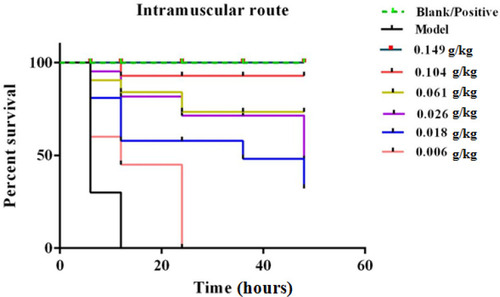
Figure 2 Inhibition of in vivo MRSA activity via administration of geraniol by gavage.
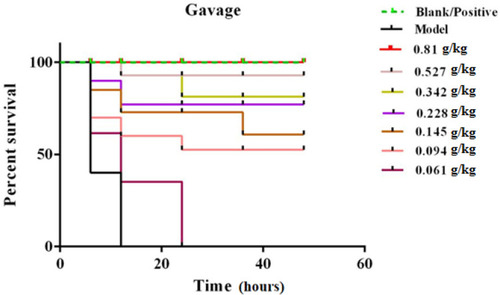
Figure 3 Effect of geraniol on inflammatory factors in MRSA-infected blood. B: control group, N: model group, P: positive control group, H: high dose group, M: medium-dose group, L: low dose group. *<0.05, **<0.01 represents a significant and very significant difference among the groups compared to control, respectively. Δ<0.05, ΔΔ<0.01 represents a significant and very significant difference among the groups compared to the model, respectively. ##<0.01 represents very significant difference among the groups compared to the positive control.
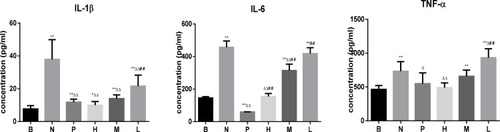
Figure 4 Effect of geraniol on oxidative factors in MRSA-infected blood. B: control group, N: model group, P: positive control group, H: high dose group, M: medium-dose group, L: low dose group. *<0.05, **<0.01 represents a significant and very significant difference among the groups compared to control, respectively. Δ<0.05, ΔΔ<0.01 represents a significant and very significant difference among the groups compared to the model, respectively. #<0.05, ##<0.01 represents a significant and very significant difference among the groups compared to the positive control, respectively.
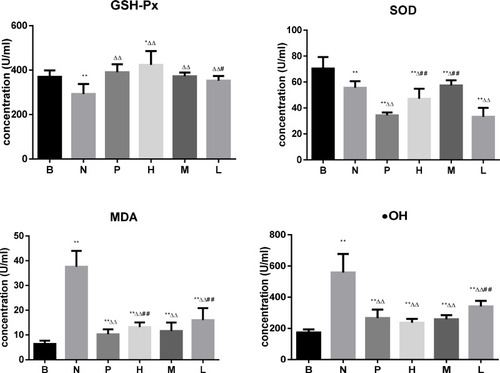
Figure 5 Bacteria loads of organs (blood, lung, and liver) in control and geraniol injected groups. B: control group, N: model group, P: positive control group, H: high dose group, M: medium-dose group, L: low dose group.
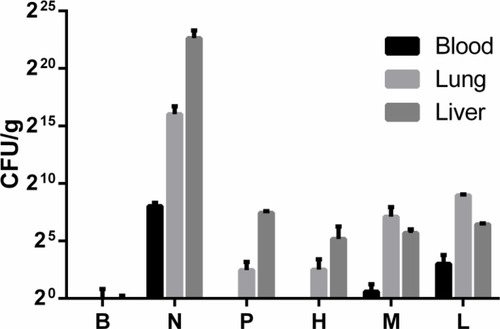
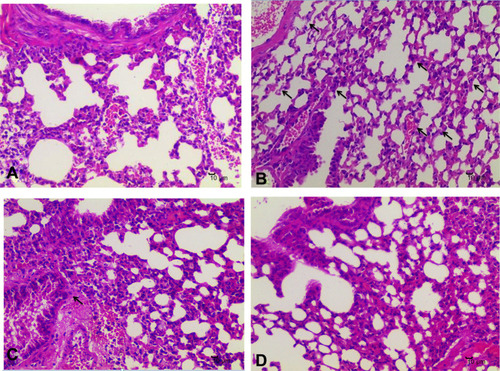
Figure 6 The pathological changes of the lung tissue of MRSA-infected mice. (A): control group, (B): model group.
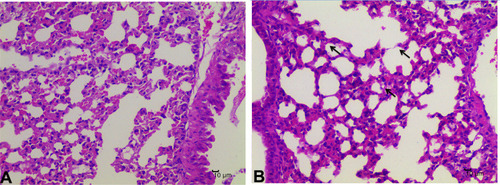
Figure 7 The pathological changes of the liver tissue of MRSA-infected mice. (A): control group, (B): model group.
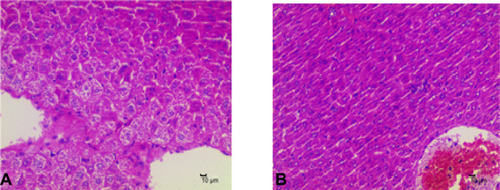
Figure 8 The pathological changes of the kidney tissue of MRSA-infected mice. (A): control group, (B): model group.
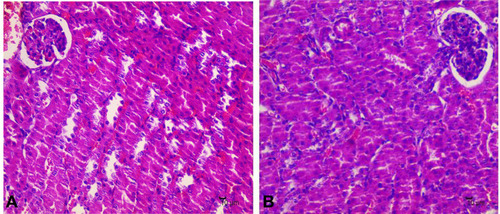
Figure 9 Effect of geraniol on lung tissue of MRSA-infected mice. (A): control group, (B): model group, (C): positive control group, (D): experimental group.