Figures & data
Table 1 Antimicrobial Susceptibility of the E. coli Strains Used in This Study
Table 2 Phenotypic and Genotypic Profiles of the in vitro Selected Mutants of mcr-1-Positive and mcr-1-Negative E. coli
Figure 1 Changes in the colistin susceptibility of selected mutants. Five mcr-1-positive and three mcr-1-negative E. coli strains were exposed to colistin in a multi-stepwise manner. MIC was measured by the broth dilution method. Mutants with the highest MIC were used for next-step induction and selection processes. Mu1, Mu2, Mu3, and Mu4 indicate the first, second, third, and fourth cycles of induction, respectively.
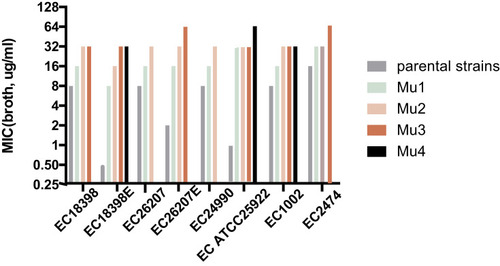
Figure 2 Mutation frequencies of mcr-1-positive and negative strains when cultured with colistin at its MICs for the parent strains and sub-parental mutants. The colistin MICs of the tested strains were determined by the agar dilution method. Solid line, mcr-1-positive strains; dotted line, mcr-1-negative strains.
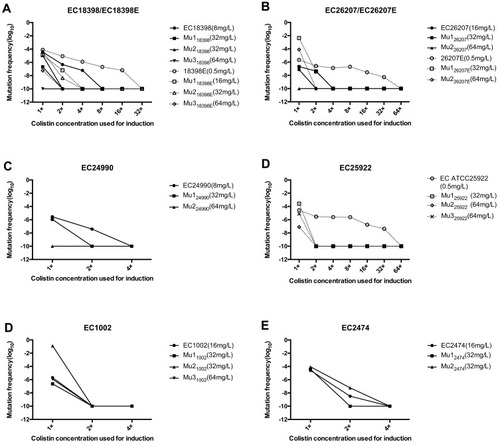
Figure 3 Domains of the PmrA/PmrB and PhoP/PhoQ two-component system and the positions of all mutations in colistin-resistant mutants. *These substitutions are predicted to affect protein function by SIFT. #These substitutions are predicted to affect protein function by SIFT because the sequences used were not sufficiently diverse. Red, EC18398E; Fuchsin, EC26207; Blue, EC26207E; Black, EC25922; Green, EC1002; Brown, EC2474. Domains of PmrA/PmrB and PhoP/PhoQ are indicated as REC, CheY-homologous receiver domain; Trans_reg_c, transcriptional regulatory C-terminal domain; TM1, first transmembrane domain; TM2, second transmembrane domain; HAMP, histidine kinases, adenylyl cyclases, methyl-binding proteins, and phosphatases domain; HisKA, histidine kinase domain; HATPase_c, histidine kinase-like ATPase C-terminal domain.
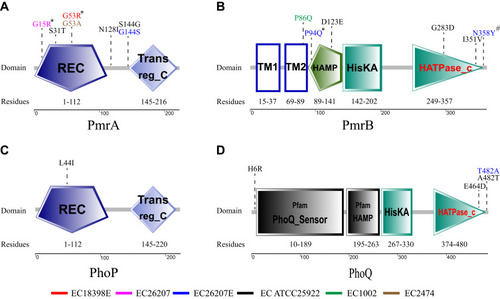
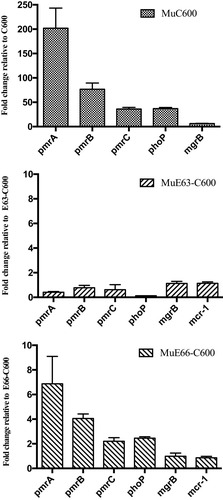
Figure 4 Transcriptional activities of pmrABC, phoP, mgrB, and mcr-1 in wild-type isolates and their derivative colistin-resistant mutants (MuC600, MuE63-C600, and MuE66-C600) grown in drug-free MHB. The fold change in transcription was calculated as 2−ΔΔCT. Means and standard deviations were determined for three independent replicates.