Figures & data
Table 1 Carbapenem Susceptibility of ECC Clinical Isolates
Table 2 Minimum Inhibitory Concentrations (MICs) of 113 Carbapenem-Nonsusceptible ECC Isolates
Figure 1 Antibiotic resistant mechanisms determined in the Enterobacter cloacae complex (ECC) isolates and multilocus sequence typing (MLST) in this study. (A) Carbapenem resistance genes; (B) extended-spectrum β-lactamases (ESBLs) phenotypic test for the phenotypic detection of ESBLs production; (C) β-lactam resistance genes; (D) expression of outer membrane porins genes and cephalosporinase gene ampC; (E) carbonyl cyanide 3-chlorophenylhydrazone (CCCP) was used to detect the activity of efflux pumps in carbapenem-nonsusceptible ECC isolates; (F) sequence typing (ST) of ECC. Blue, purple, and yellow squares represent positive. Gray squares represent negative. The purple square with an up arrow represents the overexpression of genes, and the purple square with a down arrow represents the low expression of genes.
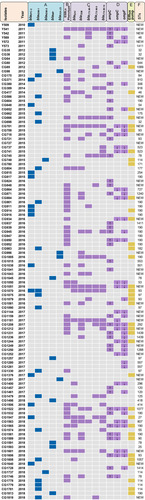
Figure 2 Performing goeBURST analysis on the molecular epidemiological characteristics of 79 ECC isolates. The population snapshot indicates the clonal assignment of the sequence typing (ST) presented in this study. Each green dot represents one ST, the numbers in the dot represent ST types, and the dot size represents their abundance in the ST set.