
Figures & data
Table 1 Basic Clinical Characteristics of Enrolled Patients
Figure 1 Evaluation of SARS-CoV-2 probe-primer set using plasmid standards. (A) Dilution curve of plasmid standards quantification by ddPCR. Correlation between expected and observed copy number were showed. Each black square represents a single replicate well of the dilution experiment, whereas the regression line is based on the average concentration at each dilution. (B) Probit analysis sigmoid curve reporting the lower limit of detection of ddPCR per reaction.
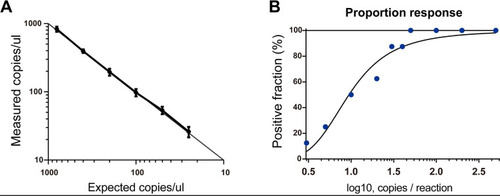
Figure 2 Comparison of positive rates of SARS-CoV-2 detection in tears using different methods.
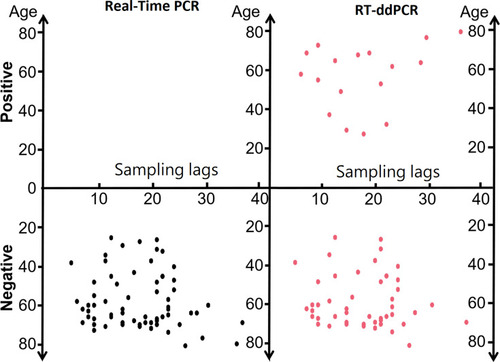
Figure 3 Distribution features of SARS-CoV-2 in the blood, tears, and nasopharyngeal samples during COVID-19 pneumonia courses.
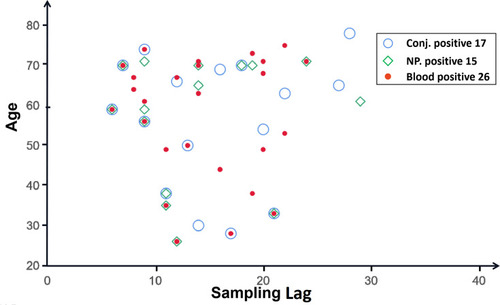
Table 2 Correlation Analysis of Positive One-Step RT-ddPCR Tear Specimens