Figures & data
Table 1 Proteins Chosen for Investigation of DEPs in MRSE Under PS Stress
Table 2 Primers for RT-PCR
Figure 1 Significantly differential proteins of MRSE in 2.5mg/mL PS stress using TMT-based quantitative proteomics. (A) The horizontal axis is the relative quantitative protein value after Log2 logarithm conversion, and the vertical axis is the difference significance test p-value value after -Log10 logarithm conversion. The red dots indicate up-regulated proteins, and blue dots indicate down-regulated proteins. (B) The number of DEPs. Q1 (<0.769) and Q2 (0.769–0.833) represent down-regulated proteins, and Q3 (1.2–1.3) and Q4 (>1.3) represent up-regulated proteins.
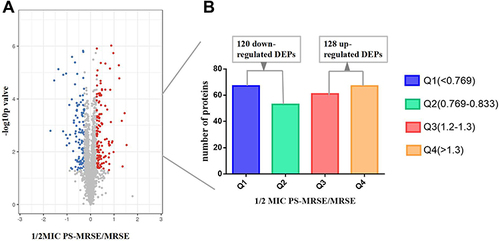
Figure 2 Continued.
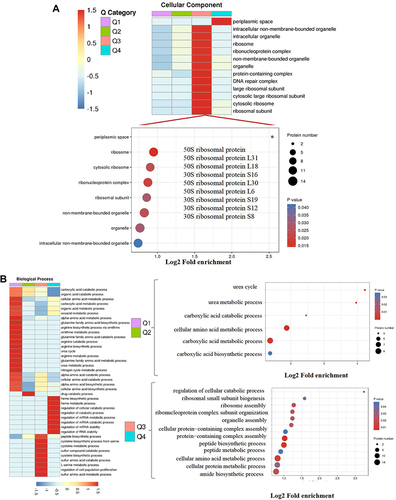
Figure 2 Continued.
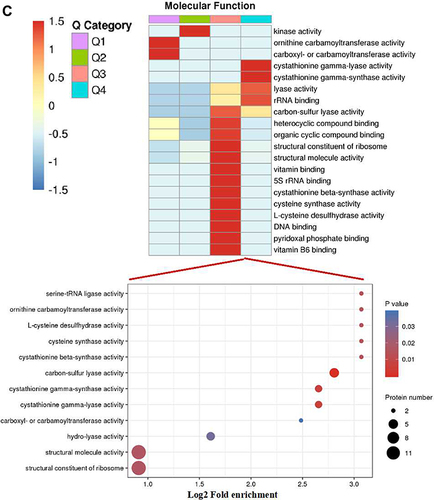
Figure 2 Go annotation and KEGG pathway of DEPs: gene ontology terms for subcellular location distribution. (A) cellular component (B) biological process (C) molecular function (D) main KEGG pathway.
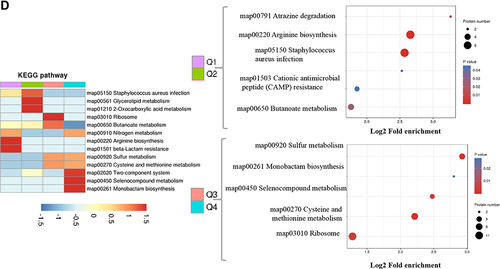
Figure 3 String network of DEPs of MRSE in PS stress. Colored lines between the proteins indicate the various types of interaction evidence. Structure which is drawn in the protein nodes indicated the availability of 3D protein structure information. (A) String network of up-regulated proteins (B) String network of down-regulated proteins.
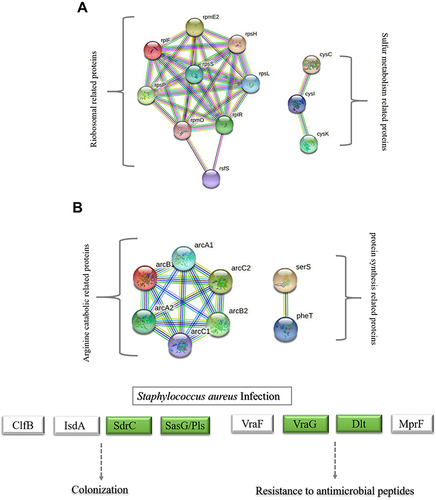
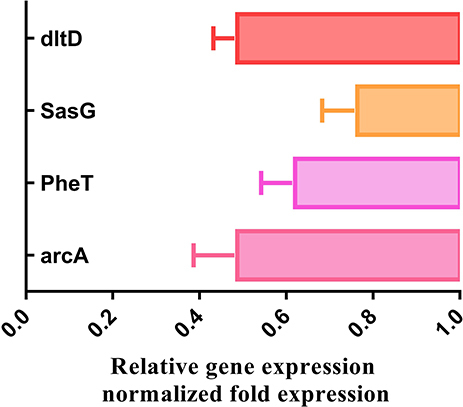
Figure 4 The mRNA levels of four genes were respectively analyzed by qPCR method in MRSE with and without PS.