
Figures & data
Table 1 Socio-Demographic Factors of Hospitalized COVID-19 Patients (n=220) to Dilla University Referral Hospital, December 2021
Table 2 Clinical Features of Hospitalized COVID-19 Patients (n=220) to Dilla University Referral Hospital, December 2021
Figure 1 Recovery of COVID-19 patients admitted to the Dilla University Referral Hospital Treatment Center by disease status at admission.
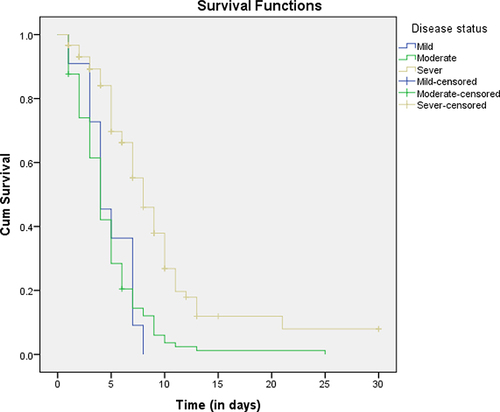
Figure 2 Recovery curve of COVID-19 patients admitted to the Dilla University Referral Hospital Treatment Center by co-morbidity with chronic diseases.
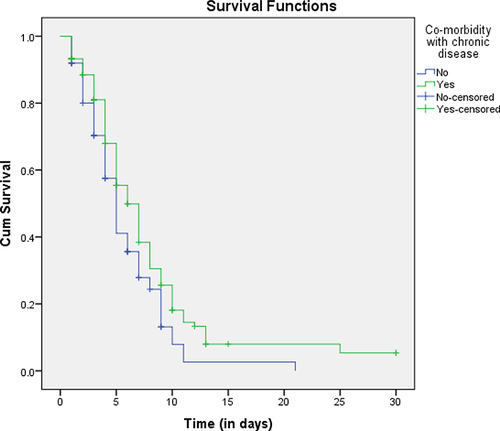
Figure 3 Recovery curve of COVID-19 patients admitted to the Dilla University Referral Hospital Treatment Center by sex.
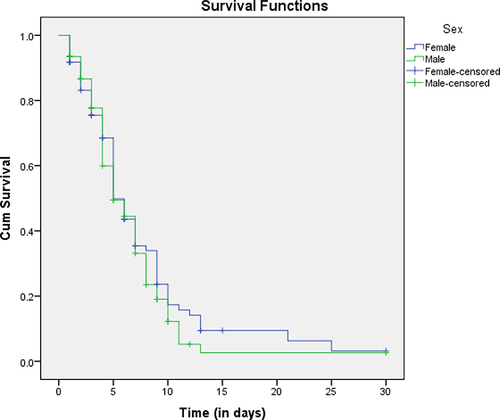
Figure 4 Recovery curve of COVID-19 patients admitted to the Dilla University Referral Hospital Treatment Center by age.
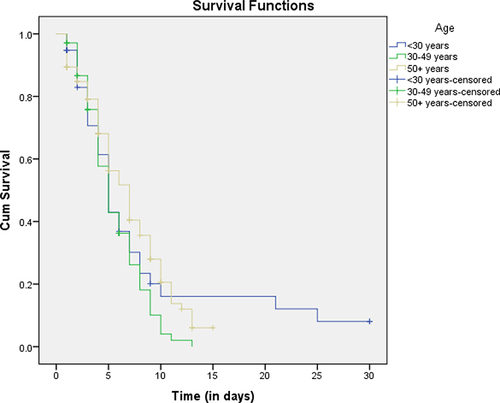
Table 3 Multivariate Cox-Regression Analysis Showing Adjusted Hazard Ratios of Clinical Features of COVID-19 Patients at Dilla University Referral Hospital, December 2021