Figures & data
Figure 1 Biological properties of phages PHB22a, PHB25a, PHB38a and PHB40a. pH stability test of phages PHB22a (A), PHB25a (B), PHB38a (C), and PHB40a (D). Phages were incubated at 37°C for 1 h in buffer at pH 7.0 was considered 100% activity. Thermal stability test of phages PHB22a (E), PHB25a (F), PHB38a (G), and PHB40a (H). Phages were incubated at 37°C for 1 h was considered 100% activity. One step growth curves of phages PHB22a (I), PHB25a (J), PHB38a (K), and PHB40a (L) in host strain MRSA S-18. The average burst sizes were 37, 113, 180 and 25 for PHB22a, PHB25a, PHB38a, and PHB40a, respectively. And the latency periods of PHB22a, PHB25a, PHB38a, and PHB40a were 10 min, 20 min, 10 min, and 10 min respectively. L: Latency period; B: Burst size. Data are expressed as the mean ± SD.
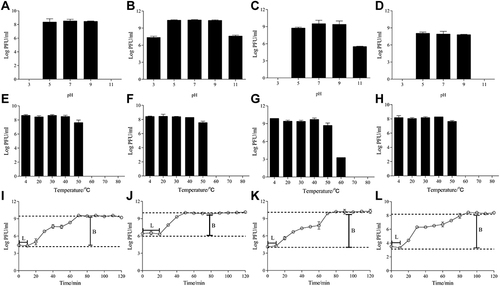
Figure 2 Antibiofilm activity of phage cocktail or cocktail with metal Ions Ca2+ and Zn2+. The value of OD590 after cocktail (108 PFU/mL) alone and cocktail (108 PFU/mL) with 10, 1.0 or 0.1mM Ca2+ or Zn2+ was applied to 24-h biofilm (A) and 48-h biofilm (B). The colony count (CFU/mL) after cocktail (108 PFU/mL) alone and cocktail (108 PFU/mL) with 10, 1.0 or 0.1mM Ca2+ or Zn2+ was applied to 24-h biofilm (C) and 48-h biofilm (D). Significant differences between the cocktail alone and cocktail with Ca2+ or Zn2+ treatment groups were determined by ANOVA (** p < 0.01, and *** p < 0.001).
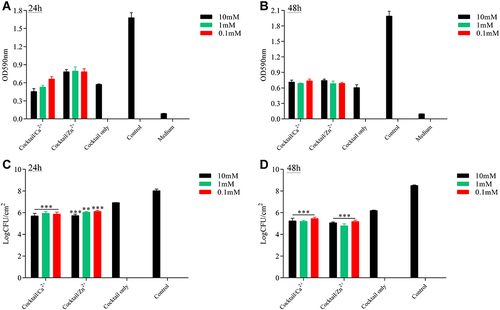
Figure 3 Scanning electron microscope observation. The magnification of the image is 5000. The 24-h and 48-h biofilm were treated with 1×10⁸ PFU/mL cocktail alone (A), 1×10⁸ PFU/mL cocktail contained with 0.1 mM Zn2+ (B), 1×10⁸ PFU/mL cocktail contained with 0.1 mM Ca2+ (C) and PBS (D).
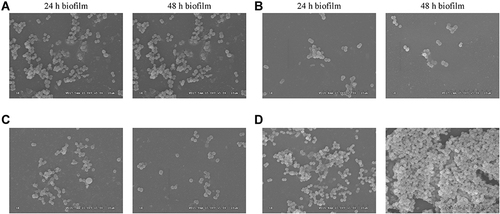
Figure 4 The effect of the phages or phage cocktail in vitro and in vivo. Effect of the phages PHB22a (A), PHB25a (B), PHB38a (C), PHB40a (D) and phage cocktail (E) on host bacteria growth of S-18. The therapeutic effect of phages PHB22a (F), PHB25a (G), PHB38a (H), PHB40a (I) and phage cocktail (J) on G. mellonella larvae with S-18 infection. Significant differences between the S-18 groups and single phages or cocktail treatment groups were determined by ANOVA (* *** p < 0.001). Data are expressed as means ± SD.
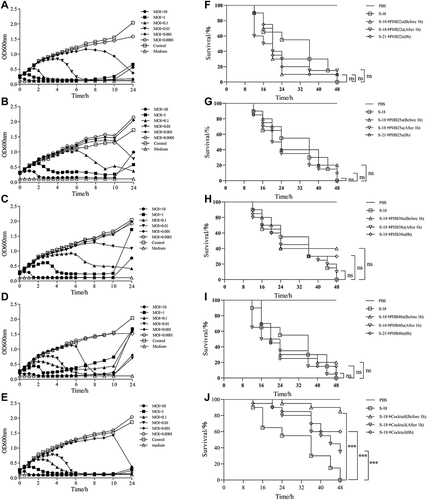
Figure 5 In vivo efficacy of phage cocktail with metal Ions Ca2+ and Zn2+ against MRSA S-18 in G. mellonella infection model. (A) Survival of G. mellonella treated with cocktail (4 × 10⁷ PFU) alone and cocktail (4 × 10⁷ PFU) with 0.1mM Ca2+ or Zn2+ before infection 1 h. (B) Survival of G. mellonella treated with cocktail (4 × 10⁷ PFU) alone and cocktail (4 × 10⁷ PFU) with 0.1mM Ca2+ or Zn2+ after infection 1 h. (C) Survival of G. mellonella simultaneously treated with cocktail (4 × 10⁷ PFU) alone and cocktail (4 × 10⁷ PFU) with 0.1mM Ca2+ or Zn2+. The larvae pre-treated with cocktail with 0.1mM Ca2+/Zn2+ showed significant increased survival rates compared to S-18 groups (p < 0.001). The larvae post-treated with cocktail with 0.1mM Ca2+ showed significant increased survival rates compared to S-18 groups (p < 0.01), and cocktail with 0.1mM Zn2+ showed significant increased survival rates compared to S-18 groups (p < 0.05). The larvae simultaneously treated with cocktail with 0.1mM Ca2+/Zn2+ showed significant increased survival rates compared to S-18 groups (p < 0.001). Significant differences between the S-18 groups and cocktail/Ca2+ or cocktail/Zn2+ groups were determined by ANOVA (* p < 0.05, ** p < 0.01, and *** p < 0.001). Data are expressed as means ± SD.
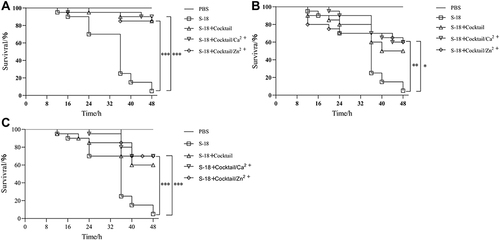
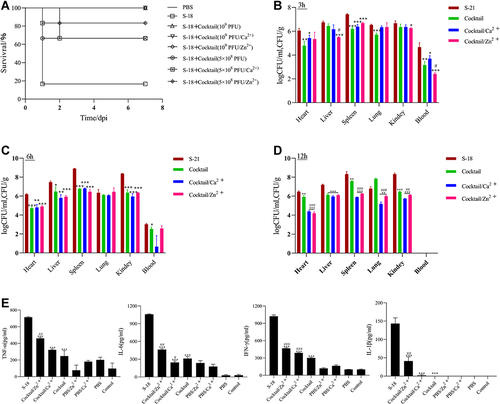
Figure 6 Protective effect of phage cocktail pretreatment in mice infected with MRSA S-18 strain. (A) Survival of mice were infected with MRSA S-18 treated with cocktail (1 × 10⁹/5×108 PFU) alone, cocktail (1 × 10⁹ /5×108 PFU) with 0.1mM Ca2+/Zn2+, and PBS. Bacterial abundances in different tissues from mice pre-treated with cocktail (1 × 10⁹ PFU) alone or cocktail (1 × 10⁹ PFU) with 0.1mM Ca2+/Zn2+ at 3h (B), 6h (C) 12h (D). (E) Levels of inflammatory cytokines in groups S-18, cocktail (1 × 10⁹ PFU) alone, cocktail (1 × 10⁹ PFU) with 0.1mM Ca2+ and cocktail (1 × 10⁹ PFU) with 0.1mM Zn2+. Significant differences between the cocktail alone or cocktail with Ca2+/Zn2+ treatment groups and untreated groups were determined by ANOVA (* p < 0.05, ** p < 0.01, and *** p< 0.001). For the comparisons between the cocktail with Ca2+/Zn2+ treatment groups and the cocktail alone treatment groups, significance is indicated by ANOVA (#p < 0.05, ##p < 0.01, ### p < 0.001). Data are expressed as means ± SD from three independent experimental replicates (n = 3).