Figures & data
Table 1 Number of Samples Collected from Vaccinated Individuals at Different Time Points
Table 2 Demographic and Clinical Factors Influencing Vaccine-Induced Immune Responses
Figure 1 Antibody responses post-COVID-19 vaccines.
Notes: (A) IgG induced by COVID-19 vaccination was evaluated in serum samples of non-infected people at six time points: pre-vaccine (baseline), post-prime, post-boost, 6 months, 1 year, and 3 weeks post-third dose. (B) Antibody responses are shown as per type of vaccine: AZ1222: brown symbols and, BNT162b2: pink symbols. Data in A and B are shown in comparison to non-vaccinated COVID-19 convalescent cases (grayed circles). (C) Neutralizing activity of COVID-19 vaccine-induced antibodies were determined. Horizontal lines represent means with SEM.
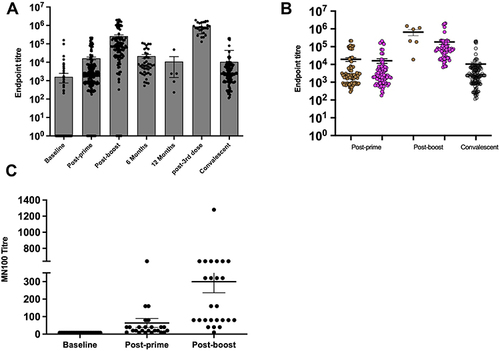
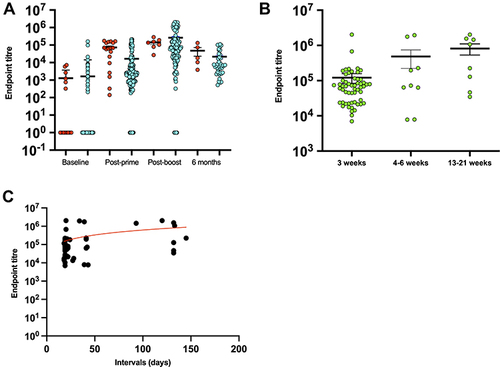
Figure 2 Impact of pre-infection and interval duration on antibody responses to COVID-19 vaccines.
Notes: (A) IgG titers in pre-infected vaccinated individuals (shown as red symbols) were compared to non-infected vaccinated individuals (shown as blue symbols). (B) IgG titers according to the duration of interval between prime and boost. (C) A correlation between the number of days in the interval and the IgG titers; Spearman r=0.3. Horizontal lines represents mean with SEM.