Figures & data
Table 1 Characteristics of Patients in ICU-1
Figure 1 The timeline of patients in ICU-1 and ICU-2. (A) Timeline of 13 patients enrolled in ICU-1. The corresponding strain numbers were showed near patient’s number. Black and red box showed sample data of CRKP and CRAB, respectively. The room stay of Room 1, 2, 3, 4 in ICU-1 was represented by different stripes. Red star meant the death date of patient. (B) Timeline of 11 patients enrolled in ICU-2. The corresponding strain numbers were showed near patient’s number. Black and red box showed sample data of CRKP and CRAB, respectively. The room stay of Room 1, 2, 3, 4 and 5 in ICU-2 was represented by different stripes. Red star meant the death date of patient.
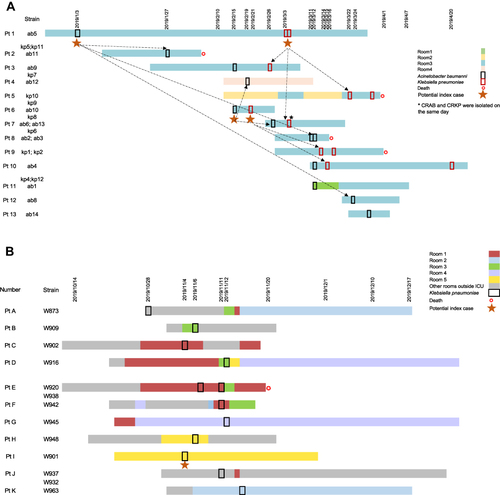
Table 2 Characteristics of Patients in ICU-2
Figure 2 Phylogenetic tree of CRKP isolates in ICU-1 and ICU-2. (A) The genetic structure of total 30 CRKP isolates. The yellow and green range represented two clades in ICU-1 while purple range indicated strains in ICU-2. (B) The detailed phylogenetic tree of CRKPs in ICU-1. The upper branch indicated Clade 1, and the lower branch was classified Clade 2. (C) The detailed phylogenetic tree of CRKPs in ICU-2. Samples with grey dots showed strains isolated from environment. Sequence type were showed as stripes. Blue and red binary data meant antibiotic resistance genes (including resistance genes against aminoglycoside, beta-lactams, carbapenem, fluoroquinolone, and macrolide) and virulence genes (rmpA, rmpA2, and iuc1), respectively.
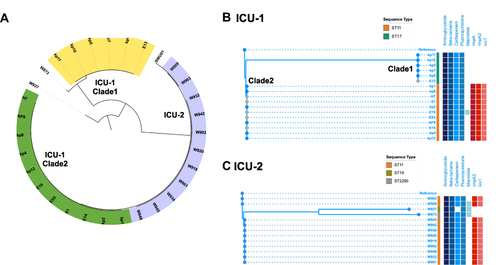
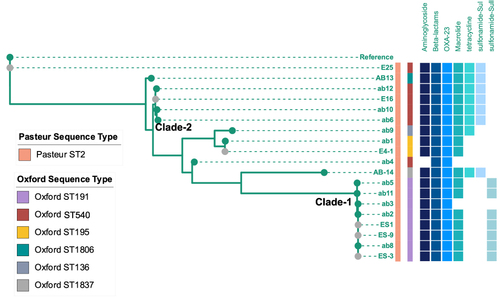
Figure 3 Phylogenetic tree of CRAB isolates in ICU-1. Samples with grey dots showed strains isolated from environment. Sequence type were showed as stripes. Blue binary data meant antibiotic resistance genes (including resistance genes against aminoglycoside, beta-lactams, macrolide, tetracycline, and genes of OXA-23, sul and Sull).