Figures & data
Table 1 Clinical Bacterial Isolates and Their Antimicrobial Resistance Patterns
Table 2 Lytic Activity of Phages ΦJHS and ΦSMK Against Tested Bacterial Strains
Figure 1 Medical implants used for biofilm experiment. (A) Foley balloon catheter. (B) Endotracheal tube. (C) 15-mm long catheter tube cut in half. (D) 12-mm long endotracheal tube cut in half. (E) Catheter segment and (F) endotracheal tube segment placed in (G) sterile 24-well culture plate.
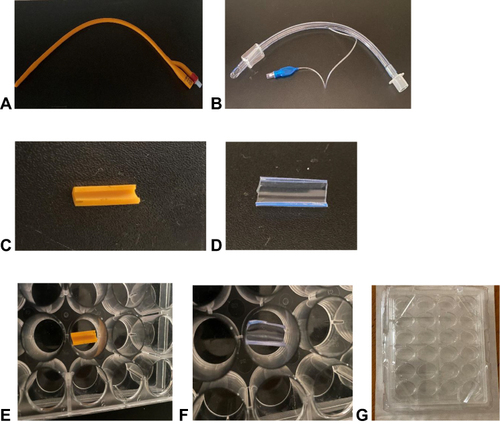
Figure 2 Plaques formed by bacteriophages (A) ΦJHS and (B) ΦSMK on the lawn of PA 1139 strain using the double agar overlay method. The bar corresponds to 1 mm.
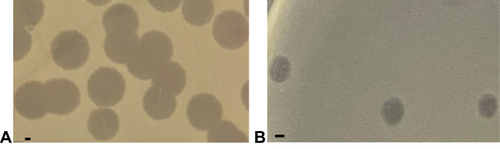
Table 3 Stability of Phages ΦJHS and ΦSMK to External Physical and Chemical Factors
Figure 3 Biofilms formed by MDR PA clinical isolates cultured for 24 h at static non-renewal condition, as analyzed by crystal violet staining procedure and shown as O.D values measured at a wavelength of 630 nm. All assays were performed in triplicates. The values presented are mean ± SD from two readings of triplicate experiments (n = 6).
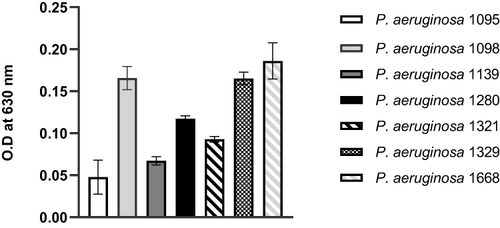
Figure 4 Lytic activity of bacteriophages on biofilms formed by MDR PA clinical isolates after 6 h treatment with phages ΦJHS-PA1139 and ΦSMK-PA1139, as analyzed by crystal violet staining procedure and shown as O.D values measured at a wavelength of 630 nm. The values presented are mean ± SD from two readings of triplicate experiments (n= 6). Statistically significant differences between control and analyzed samples are marked with asterisks (p < 0.001 (⁎⁎⁎) in the multiple unpaired t-tests).
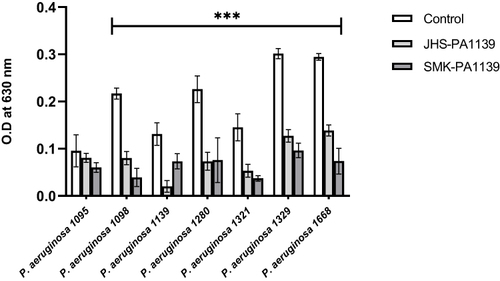
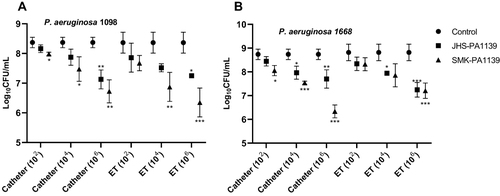
Figure 5 Microbial load inhibition of MDR PA 1098 (A) and 1668 (B) biofilm formation on non-coated and phage-coated catheter and ET segments, quantified as log10CFU/mL. The values presented are mean ± SD from two counts of triplicate experiments (n= 6). Statistically significant differences between control and analyzed samples are marked with asterisks (p < 0.01 (⁎⁎), p < 0.001 (⁎⁎⁎) in the multiple unpaired t-tests).
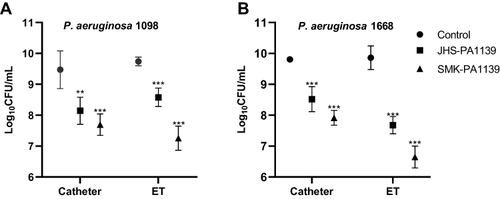
Figure 6 Microbial load reduction with 6 h phage treatment of MDR PA 1098 (A) and 1668 (B) biofilms formed on catheter and ET segments, quantified as log10CFU/mL. The values presented are mean ± SD from two counts of triplicate experiments (n = 6). Statistically significant differences between control and analyzed samples are marked with asterisks (p < 0.05 (⁎), p < 0.01 (⁎⁎), p < 0.001 (⁎⁎⁎) in the multiple unpaired t-tests).