Figures & data
Figure 1 A chest CT scan of the 66-year-old man showing Pneumocystis jirovecii Pneumonia and Mycobacterium tuberculosis Infection. (A) A transverse chest CT scan obtained on the first day after admission showed multiple ground-glass opacities in both lungs (white arrow), and an area of consolidation in the left upper lung lobe (black arrow). (B) A follow-up chest CT scan obtained 1 month after admission showed the ground-glass opacities in both lungs were reduced (white arrow), but the left upper lobe consolidation was enlarged (black arrow). (C) A follow-up chest CT scan obtained on month 41 after initial admission showed gradual absorption of the ground glass opacities in both lungs (white arrow), a decrease in the left upper lobe consolidation, and a gradual disappearance of the multiple lung nodules (black arrow).
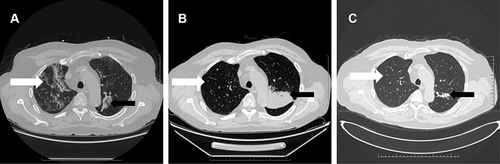
Figure 2 Pathological examination of bronchoscopy samples. (A) Pathological examination of bronchoscopy samples obtained on month 2 after the first admission showed a wide alveolar cavity, fibrous proliferation, collagenization, lymphocyte infiltration, and carbon dust deposition. The formation of small focal granulomas can be seen, with inflammatory necrosis and small abscesses in the center (white arrow). The lesion was consistent with tuberculosis. (B) A smear of secretions: acid-fast bacillus was found, ++, the shape suggested M. tuberculosis (white arrow).
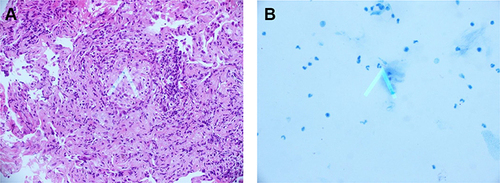
Figure 3 Three-dimensional CT Reconstruction of the Lungs. The consolidation in the left upper lung lobe and the multiple lung nodules gradually disappeared. CT was obtained on month 3 after the first admission. m, months.
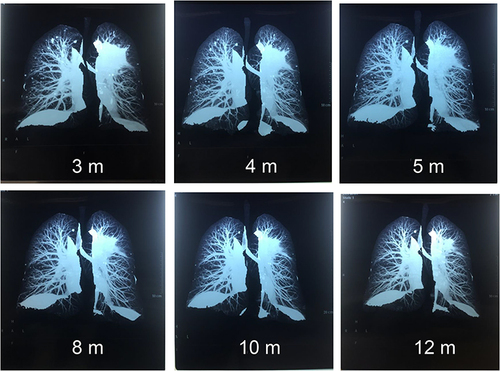
Figure 4 Timeline of diagnostic testing, imaging, and procedures. For treatment, each bar indicates the time between starting and ending.
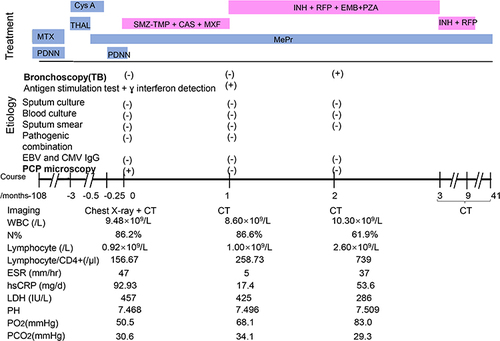
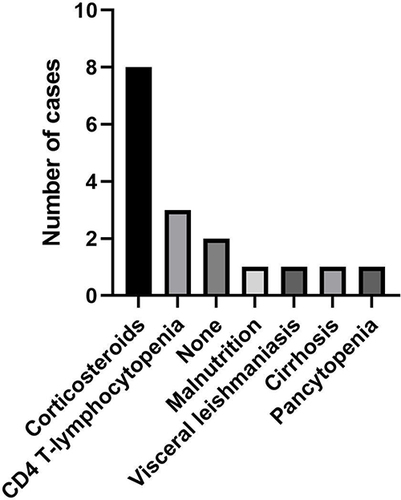
Figure 5 Distribution of predisposing factors for TB and PCP coinfection in cases reported in literature.