Figures & data
Figure 1 Flow chart of the study. Firstly, blood samples from sepsis patients and normal subjects were collected, then differential proteins and differential genes were screened by DIA protein profile and RNA sequencing combined with bioinformatics methods; then proteomics and genomics data were jointly analyzed; later, intersecting targets were taken for PPI and GO analysis, and four potential core genes were finally clarified by meta-analysis. Finally, scRNA-seq was used to clarify the cell lines localization of the target genes.
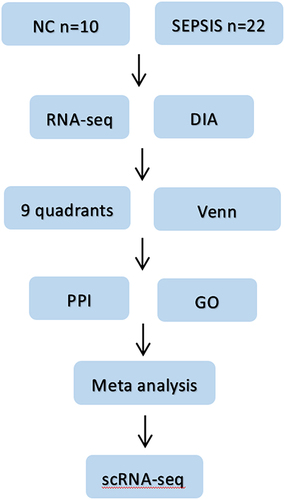
Table 1 Clinical Information of Patients with Sepsis and Normal Controls
Figure 2 Data quality control and differential screening. (A) the y-axis of box plot represents logarithmicized FPKM (Fragments Per Kilobase of exon model per Million mapped fragments), also known as log10 (FPKM), and showing that the data of each sample are homogenized and distributed at the same level and are comparable; (B) PCA showing that the two groups are clearly distinguishable and there were no outliers; (C) volcano plot showing up-regulated (red) and down-regulated (blue) genes screened by differential analysis, the horizontal coordinate is the gene expression in the sepsis group and the vertical coordinate is the gene expression in the normal group; (D) volcano plot showing up-regulated (purple) and down-regulated (green) proteins screened by differential analysis, with the logarithm of the difference multiplicity (log2) as the horizontal coordinate and the negative logarithm of the p-value (log10) as the vertical coordinate.
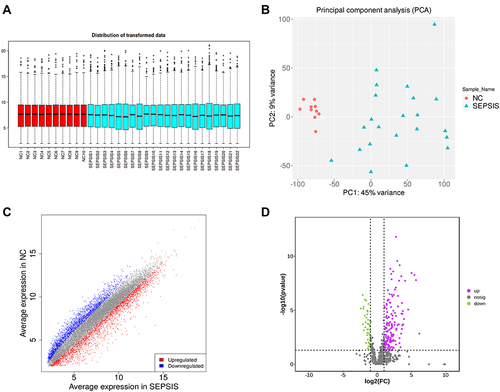
Table 2 Proteomics Combined with Transcriptomics Analysis
Figure 3 Transcriptome-proteome association analysis. (A) Nine-quadrant diagram showing 203 intersecting targets between transcriptome and proteome, including 8 targets in quadrants 1 or 9, 36 targets in quadrants 2 or 8, 31 targets in quadrants 3 or 7, 54 targets in quadrants 4 or 6, and 73 targets in quadrant 5. (B) Venn diagram showing 25 intersecting targets with differential expression between the proteomic and the transcriptome.
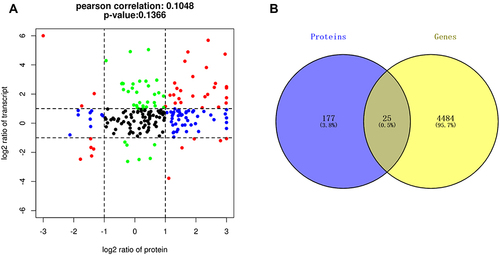
Figure 4 Intersectional gene analysis. (A) PPI network showing light green for myeloid leukocyte activation, purple for neutrophil degranulation, yellow for inflammatory response, pink for cell activation, dark green for immune system process, dark yellow represents secretory granule, red represents extended region, and royal blue represents vesicle. (B) heat map with purple for high expression in sepsis group and green for low expression in sepsis group; sample number below and gene name on the right; color shades respond to high and low expression values. (C) BP shows that the intersecting genes are mainly enriched in myeloid leukocyte activation, exocytosis, cell activation, neutrophil mediated immunity, secretion by cell, neutrophil activation, cell activation involved in immune response. (D) CC shows that the intersecting genes are mainly located in extracellular space, extracellular exosome, extracellular vesicle, secretory vesicle. (E), MF indicates that these genes are mainly involved in lactate dehydrogenase activity, oxidoreductase activity, signaling receptor activator activity, receptor ligand activity and other molecular processes. The darker nodes are the more significant enriched gene sets, and the larger nodes represent a larger number of enriched gene sets.
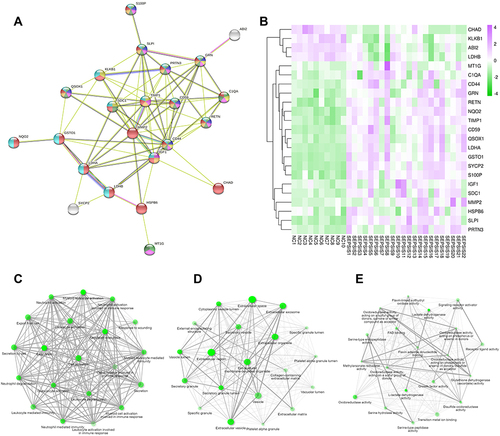
Figure 5 Meta-analysis. (A–D) represented the genes GSTO1, C1QA, RETN, GRN based on the data set GSE28750, GSE54514, GSE67652, GSE69528, GSE95233 respectively for the normal groups and sepsis groups meta-analysis, The four core genes showed low expression in the normal group and high expression in the sepsis group, and the differences were statistically significant (P<0.05).
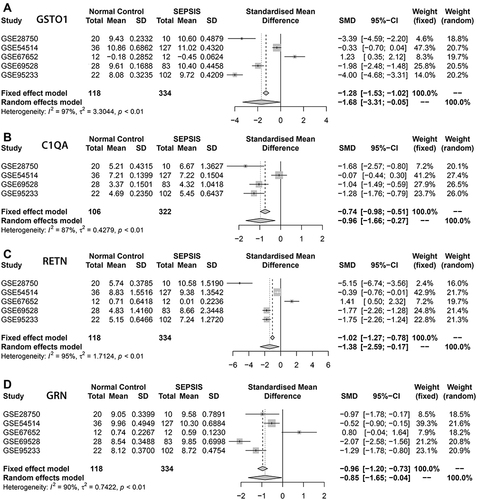
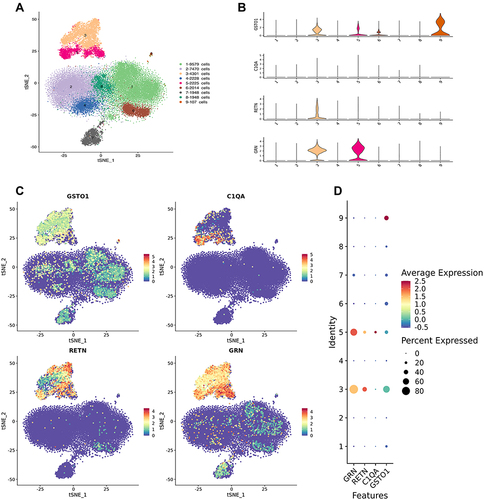
Figure 6 Single-cell RNA sequencing. (A) General map of sequencing of mixed samples. Cell populations 1,2,6 and 8 are T cells, 3 and 5 are macrophages, 4 is NK cells, 7 is B cells, and 9 is platelets. (B–D) suggest that core genes GSTO1, C1QA, RETN, and GRN are mainly localized in 3 and 5 cell populations, that is, macrophage lines.