Figures & data
Table 1 Demographic, Clinical, and Laboratory Findings of Patients with COVID‑19 on Admission
Table 2 Peak Values of Serum Liver Enzyme Parameters in Severe and Critical Patients with COVID‑19
Table 3 Clinical Characteristics of COVID-19 Patients in Different Liver Test Groups at Admission
Figure 1 The percentage of liver injury in different groups and dynamic changes of liver function indicators between the severe group and the critical group. (A) The percentage of liver injury in CURB-65 score, sequential organ failure assessment (SOFA) score, acute respiratory distress syndrome (ARDS) and ventilator groups. (B) Dynamic changes of alanine aminotransferase (ALT) and aspartate aminotransferase (AST) between the severe group and the critical group. (C) Dynamic changes of total bilirubin (TBIL) and albumin between the severe group and the critical group. (D) Dynamic changes of INR and albumin/globulin (A/G) ratio between the severe group and the critical group.
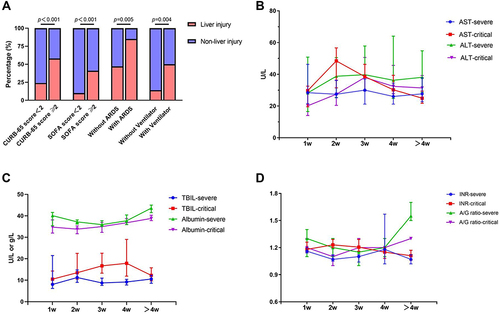
Figure 2 Dynamic changes of cycle threshold (Ct) values among different groups. (A) Dynamic changes of Ct values between the severe group and the critical group. (B) Dynamic changes of Ct values in the normal, abnormal, and liver injury group.
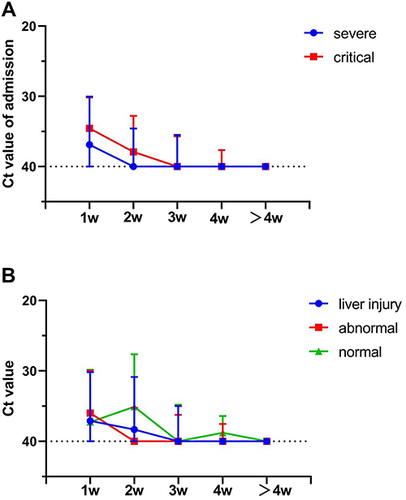
Table 4 Independent Factors Associated with Severity of Liver Injury
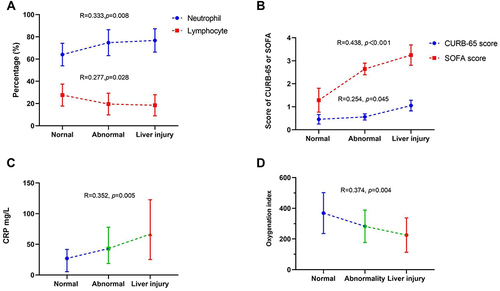
Figure 3 The correlation between the severity of liver injury and laboratory results. (A) the correlation between the severity of liver injury and the percentage of neutrophils and lymphocytes. (B) the correlation between the severity of liver injury and CURB-65 and sequential organ failure assessment (SOFA) score. (C) the correlation between the severity of liver injury and C-reactive protein (CRP). (D) the correlation between the severity of liver injury and oxygenation index.