
Figures & data
Table 1 Demographic and Clinical Data of Studied Patients
Table 2 Genotypic Detection of Carbapenemase Genes in Carbapenem-Resistant Gram-Negative Bacilli
Figure 1 Agarose gel electrophoresis of blaKPC, blaNDM, and blaOXA-48 carbapenemase genes amplicons. DNA ladder 100 bp in lane 1. (A) Lanes (2, 3, 4 and 5) positive for blaKPC gene (798bp). (B) Lanes (3, 4, and 6) positive for blaNDM gene (621bp). (C) lanes (5, 6): positive for blaOXA-48 gene (438 bp).
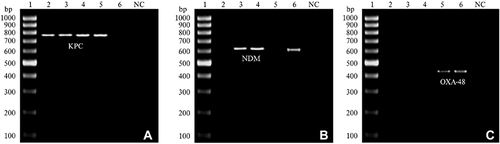
Table 3 MASTDISCS Combi Carba Plus Disc System Results in Carbapenem-Resistant Gram-Negative Bacilli
Figure 2 Positive results of MAST-Carba plus assay .(A) KPC positive, the diameter difference between disc C and disc A was ≥5 mm and <5 mm difference between disc B or disc D and disc A. (B) MBL positive, the diameter difference between disc B and disc A was ≥5 mm and <5 mm difference between disc C or disc D and disc A. (C) OXA-48 positive, the zone of inhibition around disc E was ≤10 mm with no synergy between discs A–D.
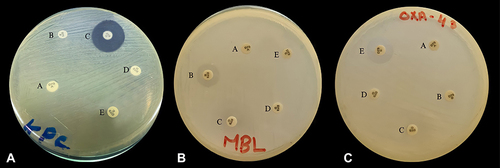
Table 4 Sensitivity, Specificity, Positive and Negative Predictive Values of MASTDISCS Combi Carba Plus Disc System in Comparison to PCR
Table 5 Univariate Cox Proportional Hazards Regression of the Association Between Demographic and Clinical Variables with Respect to Overall Survival