Figures & data
Figure 1 Photographs of P. falciparum (X 100) (A) Thick blood film showing ring stages of the parasite. (B) Thin blood film showing red blood cells containing ring stages. (C) Thin blood film showing gametocyte stage.
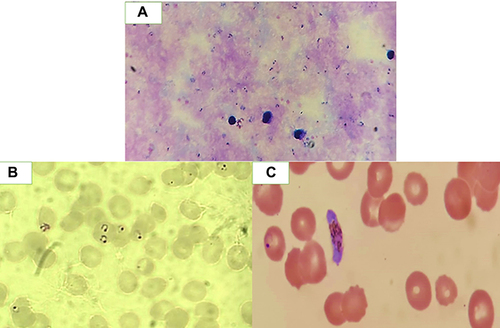
Figure 2 Allelic discrimination plot showing different sample genotypes.
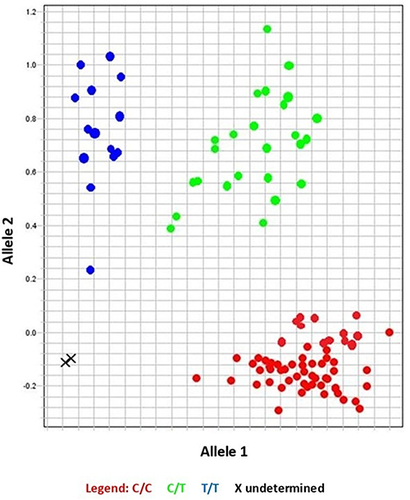
Figure 3 Amplification plot showing normalized reporter (Rn) dye fluorescence as a function of the cycle.
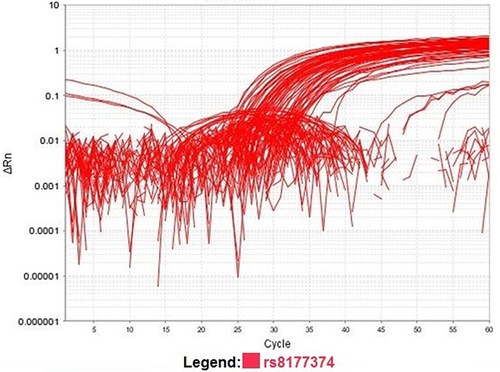
Table 1 Demographic Data of the Studied Groups and Subgroups
Table 2 Genotype and Allele Frequencies of the MAL Gene (rs8177374) Polymorphism in the P. falciparum Group and Healthy Controls
Table 3 Genotype and Allele Frequencies of the MAL Gene (rs8177374) Polymorphism in Malaria Subgroups
Table 4 The Association of the Mal rs8177374 Polymorphism with Malaria Based on Symptoms
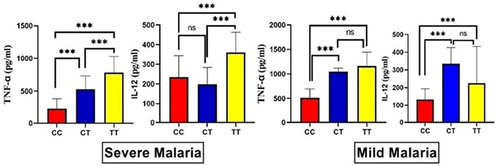
Figure 4 Serum levels of TNF-alpha in the studied groups and subgroups and in relation to Mal rs8177374 polymorphism in patients with malaria.
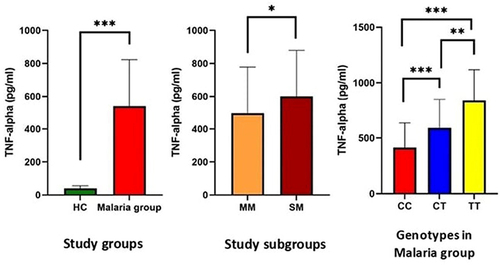
Figure 5 Serum levels of IL-12 in the studied groups and subgroups and in relation to Mal rs8177374 polymorphism in patients with malaria.
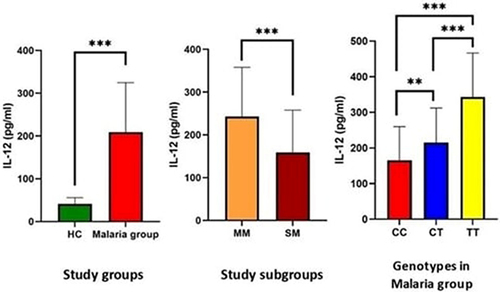
Figure 6 The levels of the circulating TNF-alpha and IL-12-malaria among both malaria subgroups in relation to Mal rs8177374 polymorphism.