Figures & data
Table 1 Prevalence of Escherichia coli O157:H7 from Different Types of Samples
Table 2 Statistical Association of Prevalence of E. coli O157:H7 with Different Risk Factors
Table 3 Antimicrobial Sensitivity Patterns of Serologically Positive Isolates of E. coli O157:H7
Figure 1 Bar-chart showing the susceptibility patterns of E. coli O157:H7 from different sample types.
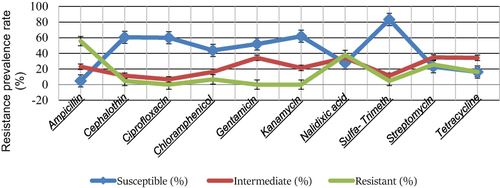
Figure 2 Conventional PCR products of hylA gene with an amplicon size of 1151 bp run on the gel electrophoresis for E.coli O157:H7 isolates.
Notes: M = 100 bp DNA marker, lane=2 and 4 are positive result for hylA gene, lane =6 and 7 negative and positive control for hylA gene respectively.
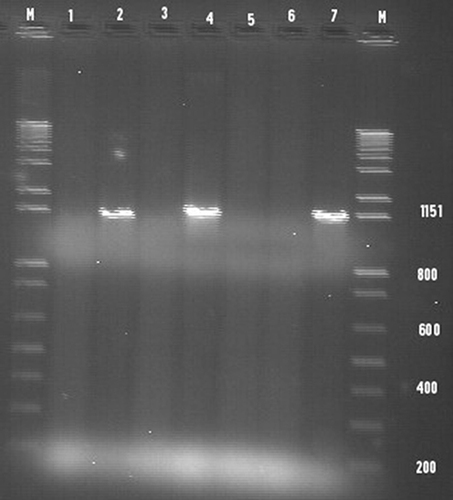
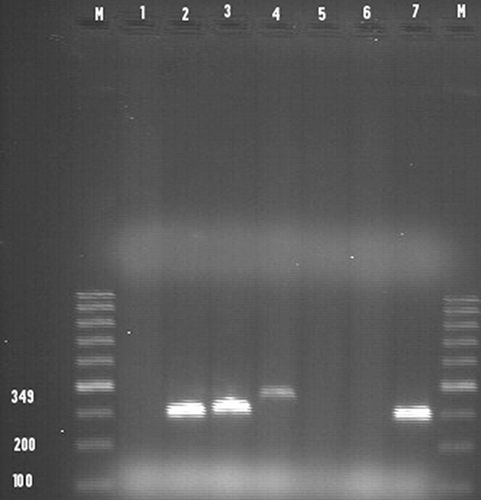
Figure 3 Conventional PCR products of stx1 gene with an amplicon size of 349 bp run on gel electrophoresis for E.coli O157:H7 isolates.
Notes: M= 100 bp DNA marker, lane=2, 3 and 4 positive results for stx1 gene, lane =6 and 7 negative and positive controls for stx1 gene respectively.