Figures & data
Table 1 Demographic Characteristics of Training Cohort and Validation Cohort
Table 2 Baseline Clinical Features of Patients with and without SARS-CoV-2 on Day 7
Figure 1 Flow diagram of patient selection. Among the 1235 patients, 52 were classified as presenting with severe COVID-19 upon admission or throughout the progression of their illness. Furthermore, 141 were minors under the age of 18 years, and 160 individuals possessed insufficient medical records. Finally, a cohort of 882 patients was incorporated into this study and stratified into the training cohort (n=618) and validation cohort (n=264) randomly.
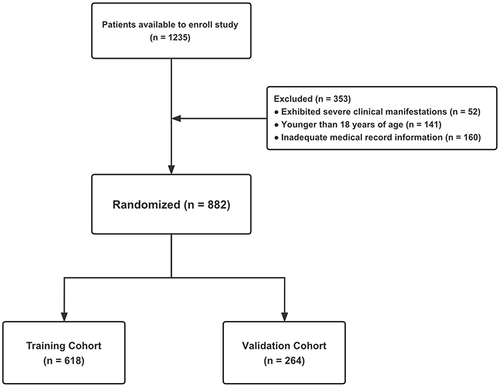
Figure 2 The selection of optimal variables for the model was carried out using LASSO regression. (A) LASSO model coefficient trendlines of the 14 variables for risk of SARS-Cov2 RNA positivity lasting longer than 7 days. (B) Tuning parameter (Lambda, λ) selection cross-validation error curve. Vertical lines were drawn at the optimal values given minimum criteria and 1-SE criteria, resulting in λ = 0.04373 and the optimization of six non-zero coefficients.
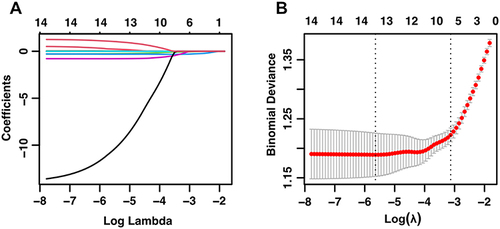
Figure 3 RCS mode evaluates the non-linearity relationship of age (A), CRP levels (B) and counts of platelets (C), leukocytes (D), lymphocytes (E), eosinophils (F) and basophils (G) to risk of SARS-Cov2 RNA positivity lasting longer than 7 days.
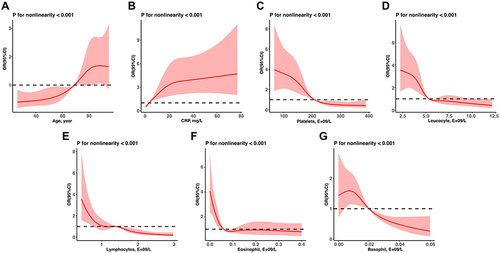
Table 3 Univariate and Multivariate Logistic Regression Analyses for Risk Factors of SARS-CoV-2 RNA Positivity Lasting Longer Than 7 Days in Training Cohort
Figure 4 Nomogram to predict the probabilities of viral shedding at 7 days. For each clinicopathological factor, find the corresponding point by drawing a vertical line from that variable to the points axis. The sum of each variable score corresponds to probability of viral shedding at 7 days.
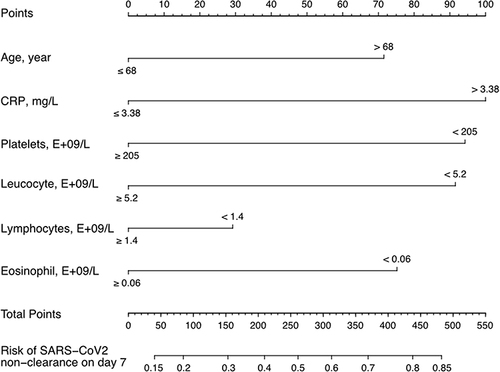
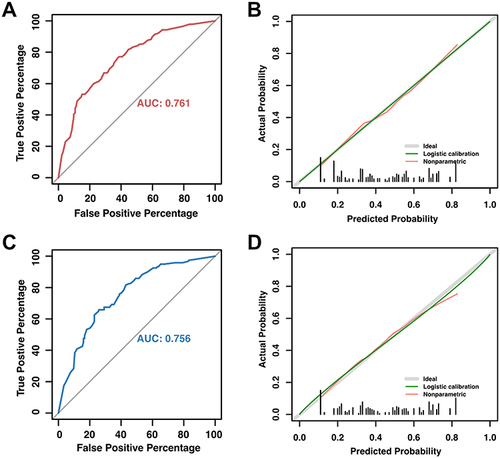
Figure 5 AUC curve and calibration plot of the nomogram for the risk of SARS-Cov2 RNA positivity lasting longer than 7 days. (A) The area under ROC curve (0.761, 95% CI: 0.724–0.799) was utilized to assess the accuracy of nomogram. (B) Calibration plot for judging the prediction of nomogram. The red line denotes bias, while the green diagonal line at a 45-degree angle represents perfect prediction. The nomogram is thought to be more reliable the closer these two lines are to one another. (C) The area under ROC curve (0.756, 95% CI: 0.697–0.816) of validation cohort. (D) Calibration plot for nomogram in validation cohort.