Figures & data
Table 1 Baseline Characteristics
Figure 1 LASSO coefficient profiles of the 12 factors. The horizontal axis represented the log(λ) value of the independent variable, the horizontal axis represented the number of variables with non-zero coefficient, the vertical axis represented the coefficient of the independent variable, and each curve represented the variation trajectory of the coefficient of each independent variable.
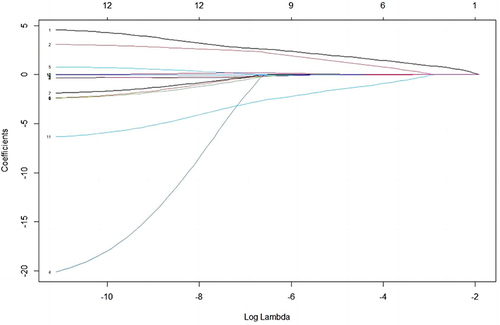
Figure 2 Ten-fold cross-validation for tuning parameter selection in the LASSO model. The dotted vertical lines were drawn at the best value of log(λ) by using the minimum criteria and 1-SE criteria. Solid vertical lines represented partial likelihood deviance ± SE. The intersection point of the left dotted line and the abscissa axis (bottom) showed the optimal value of log(λ), the corresponding value in the abscissa axis showed the number of variables with non-zero coefficient identified at the optimal log(λ).
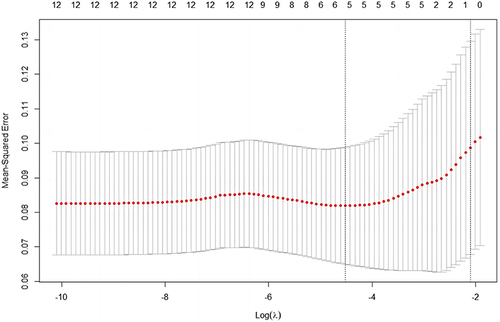
Figure 3 (A) Nomogram to pridict outcome of wound healed; (B) Calibration curve.
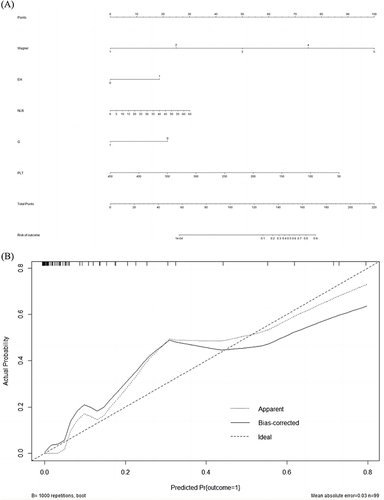
Figure 4 Decision curve analysis.
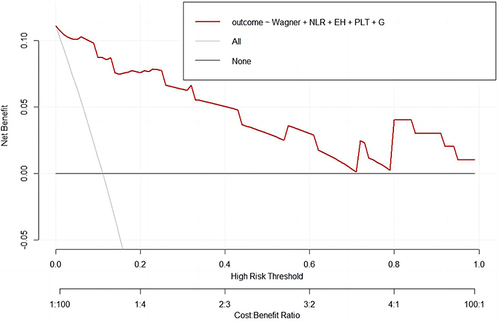
Table 2 Multivariate Logistic Regression Analysis for Predictors of Healed Wound for Diabetes Foot Patients
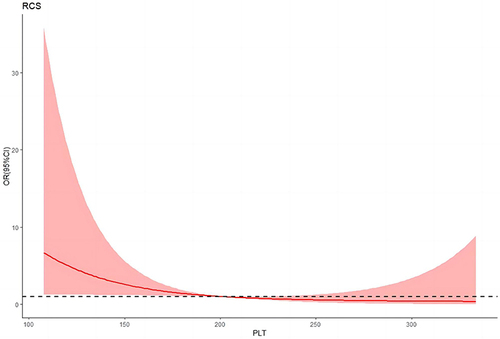
Figure 5 Association between the PLT level and wound healed rate in T2DM patients, allowing for nonlinear effects, with 95% CIs. The RCS function with 3 knots for PLT level, adjusted for Wagner grade, was performed. Curves show ORs compared with the chosen reference PLT of 200*10^9/L.