Figures & data
Figure 1 ddPCR detection flow diagram. (A)The lysostaphin-treated sample was dispersed by PCR reaction into 20,000 droplets containing target and background DNA. (B) Data output from a MDPCR experiment. The droplets form four clusters, arranged orthogonally to each other. Gray: empty droplet, negative for both targets; Purplish red: only Target A positive; Blue: only positive for Target B; Green: duplex-positive droplets.
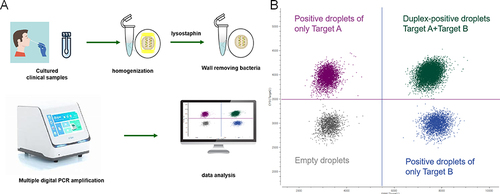
Table 1 Primer and Probe Sequences
Table 2 Comparison Table of the Concentration of Mixed Bacterial Solution
Figure 2 Primer amplification efficiency. (A) SAOUHSC_00106; (B) mecA.
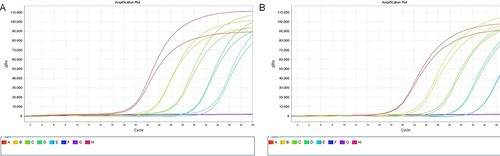
Figure 3 Enzyme selection and optimization of reaction conditions. (A) The disparity in MRSA lysis between lysostaphin and lysozyme was assessed using qPCR.; (B) The disparity in enzyme concentration and cleavage efficacy remains consistent for the duration of the same action time (5 min). The symbols on the column represent differences with the first group, NS represents no difference, ** represents significant difference with the first group, **** represents significant difference with the first group and significant difference with the ** group. (C) Reaction time optimization, the test was performed in the presence of 10μg/mL lysostaphin. A: MRcoNS, reaction time 2min; B: MRcoNS, reaction time 5min; C: MRSA, reaction time 2min; D: MRSA, reaction time 5min; E: S. aureus, reaction time 2min; F: S. aureus, reaction time 5min.
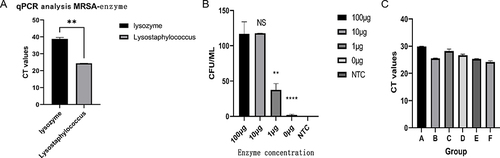
Table 3 Validation of Specificity
Figure 4 The mixed bacterial solution of S. aureus and MRcoNS was utilized to validate the robustness of the protocol, with the X-axis representing the relative concentration of SAOUHSC_00106 signal and the Y-axis indicating the ratio of duplex-positive concentration to total signal.The circle (●) is the theoretical value, and the square (■) is the actual detection value.
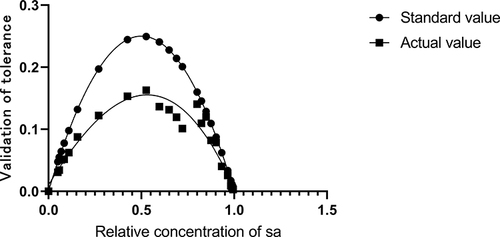
Table 4 Differences in Results of ddPCR and Drug Susceptibility Testing Clinical Samples
Figure 5 The results in 72 clinical samples were detected using single-bacterium MDPCR. The X-axis representing the relative concentration of SAOUHSC_00106 signal and the Y-axis indicating the ratio of duplex-positive concentration to total signal. The diamond (◆) is the theoretical value of the duplex-positive area, the circle (○) is the test result of MRSA samples, and the triangle (Δ) is the test result of S. aureus samples.
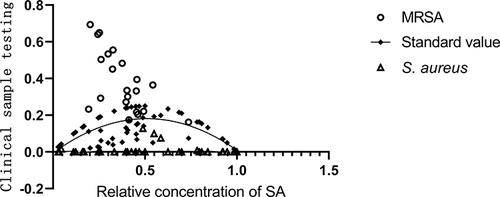
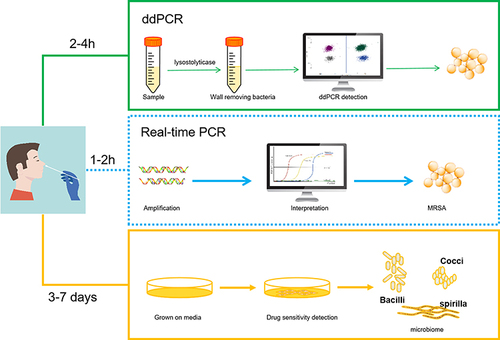
Figure 6 SMD-PCR, real-time fluorescence quantitative PCR and drug sensitivity detection of three detection schemes.