Figures & data
Table 1 Criteria for Immunohistochemistry Score
Figure 1 Immunohistochemical staining of CM and control tissue. In the CM tissue, positive VEGF expression (A), positive β-catenin expression in the cytoplasm and nuclei (B), and negative DKK1 expression (C) were displayed. In the control tissue, negative VEGF expression (D), positive β-catenin expression in the cell membrane (E), and positive DKK1 expression (F) were displayed. Positive cells exhibited brown cytoplasmic staining (at 400 × magnification).
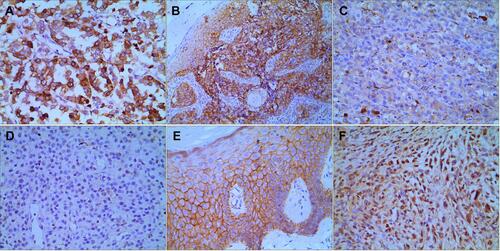
Figure 2 KM analysis for the OS probability of CM patients. The 1-, 3-, 5- year OS rates in the training cohort (78.4%, 56.3%, 43.9%) and the validation cohort (77.8%, 51.6%, 41.0%) were similar.
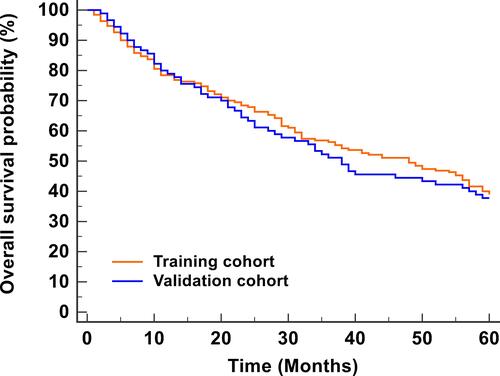
Table 2 Association of Survival with Clinical and Pathological Parameters in CM Patients Within 5 Years
Figure 3 KM analyses of indicators in predicting the prognosis of CM patients within 5 years. KM curves at different classifications of age (A), sex (B), ulceration (C), lymph node metastasis (D), distant metastasis (E), Breslow thickness (F), pathologic type (G), Clark level (H), satellite lesions (I), history of misdiagnosis (J), range of surgical resection (K), dermal mitoses (L), interferon therapy (M), VEGF (N), β-catenin (O), and DKK1 (P) were shown. It revealed that ulceration, distant metastasis, lymph node metastasis, Breslow thickness, Clark levels, dermal mitoses, β-catenin, VEGF, and DKK1 were associated with the OS.
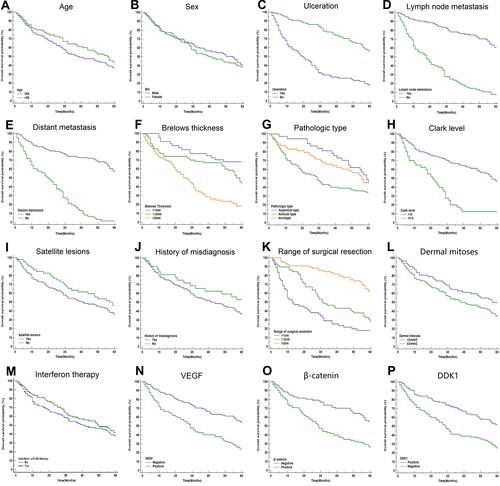
Figure 4 Multivariate COX regression analysis of independent indicators in predicting the prognosis of CM patients.
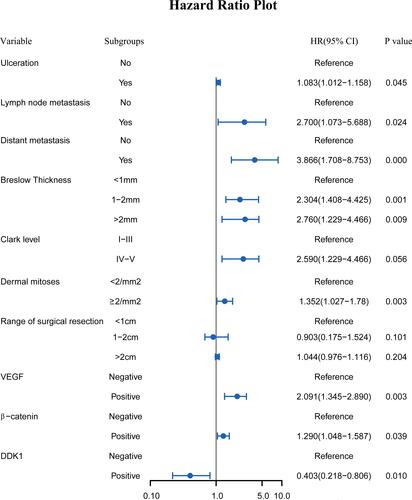
Figure 5 Nomogram predicting the prognosis of CM patients.
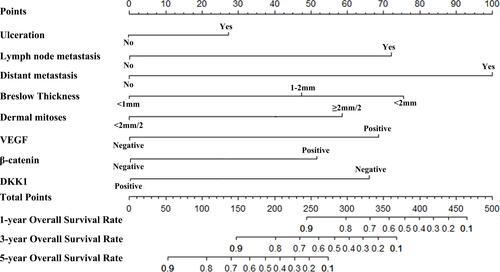
Figure 6 Internal and external validation of the nomogram predicting the OS of CM patients. The AUCs in the training cohort and validation cohort were 0.914, 0.852, 0.785 (A–C) and 0.904, 0.840, 0.773 (G–I), respectively, indicating good discrimination. The calibration plots in the training and validation datasets were shown in (D–F) and (J–L). Both indicated that the nomogram-predicted prognosis compared well with the actual prognosis.
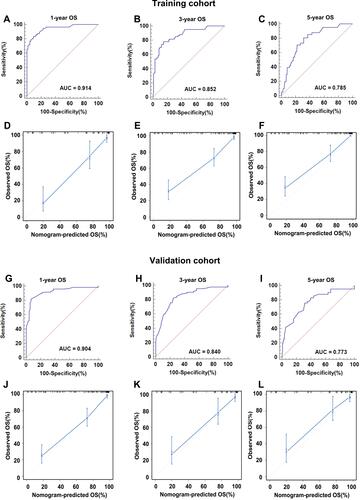
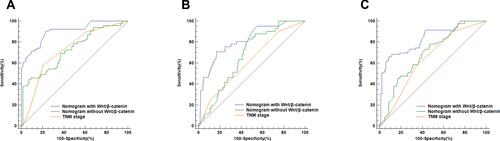
Figure 7 ROC curves of different models predicting the 1-, 3-, and 5- year OS of CM patient (A–C). The AUCs of the nomogram with the Wnt/β-catenin signaling pathway (0.914, 0.852, 0.785) were highest compared with the nomogram without the Wnt/β-catenin signaling pathway (0.693, 0.640, 0.615) and the TNM stage (0.726, 0.693, 0.673).