
Figures & data
Table 1 Demographic and Biochemical Characteristics of Subjects
Figure 1 Flow diagram of the study.
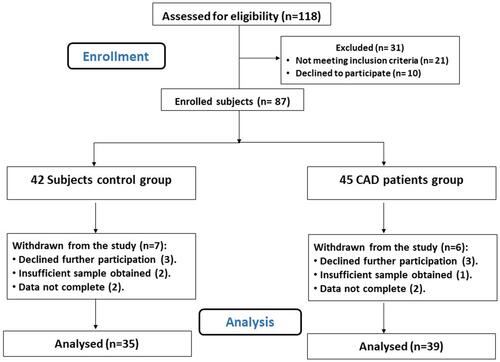
Figure 2 Differences in measured variables between the groups.
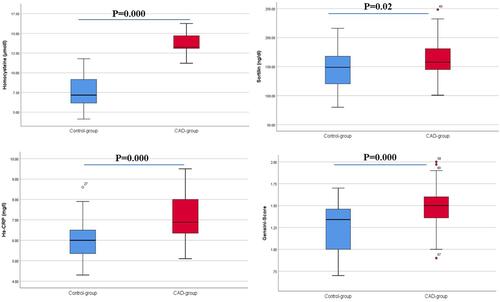
Figure 3 Area under ROC curve of the ability of measured variables to predict presence of coronary artery disease.
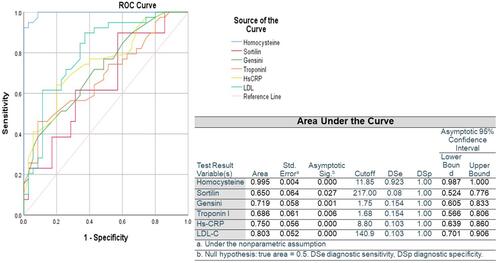
Table 2 Correlations among Measured Parameters in Both Groups
Table 3 Logistic Regression Analysis of Sortilin and Homocysteine as Independent Risk Factors of Coronary Artery Disease
Table 4 Logistic Regression Analysis of Effects of Statin and Aspirin Use and Associated Diseases in Coronary Artery Disease Patients