Figures & data
Figure 1 The process of cohort selection.
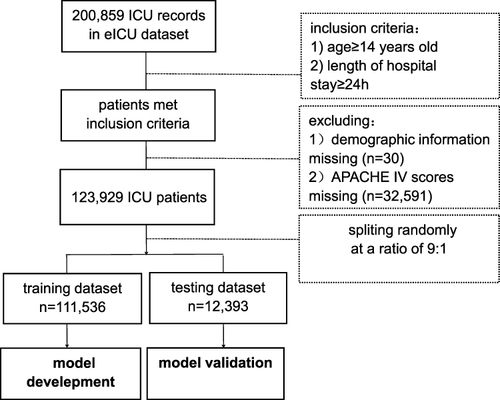
Table 1 Basic Characteristics for the Survival and Death Groups
Table 2 Model Performance in the Independent Testing Dataset for Different Machine Learning Algorithms
Figure 2 Calibration curves of the machine learning models in the test dataset. X-axis indicates the predicted mean mortality risk, Y-axis indicates the actual mean mortality risk, the slope indicates the relation between the predicted and observed outcomes.
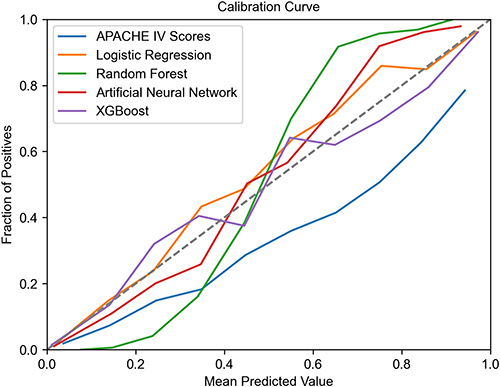
Table 3 The XGBoost Model Performance in Different Short-Term Mortality Risk Prediction Tasks
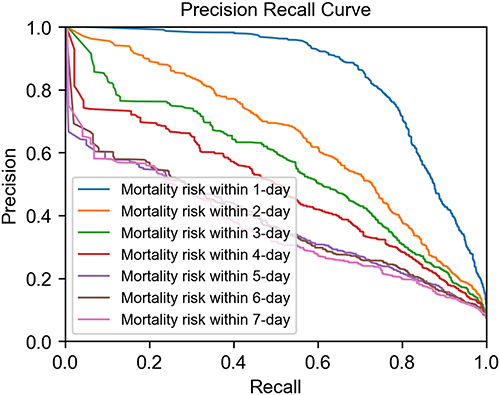
Figure 3 Precision-Recall curve of the XGBoost model in different tasks. Lines with different color indicate mortality risk prediction task within different time periods. Task with bigger area under Precision-Recall curves shows better discrimination performance.