Figures & data
Figure 1 Characteristics of plasma-derived exosomes. (A) Representative exosome image identified by a TEM (scale bar: 100 nm). (B) Nanoparticle tracking analysis (NTA) of exosomes showed they have a diameter of 30–150 nm. (C) Western blotting identified three exosome-specific markers (CD9, CD63, and TSG101).
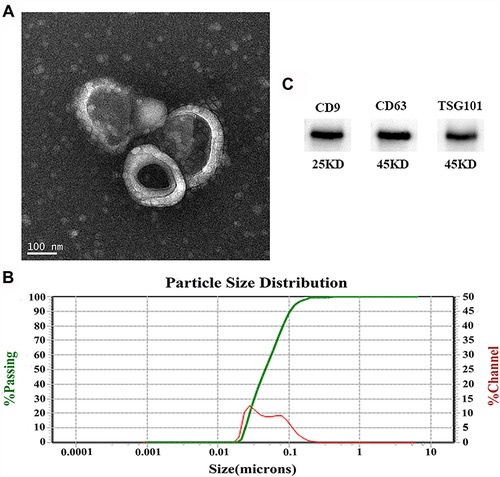
Table 1 Demographic Data of CSVD Patients and Controls
Table 2 The Screened Differentially Expressed miRNAs in the Exosomal Samples of Patients with CSVD
Figure 2 Analysis of DE miRNAs. (A) The volcano plot depicted the DE miRNAs, upregulated miRNAs and downregulated miRNAs are shown as red dots and green dots, respectively. (B) Heat maps of DE miRNAs meeting |fold change|≥1.5.
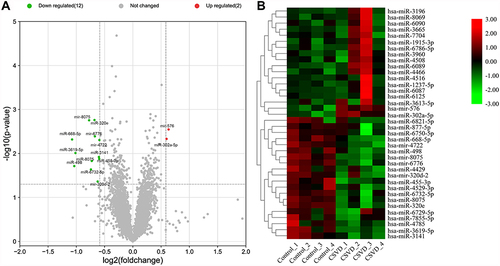
Figure 3 Enrichment of target gene function of DE miRNAs. (A) Top 20 enriched GO terms including biological processes (BP), cellular components (CC), and molecular functions (MF). (B) Top 20 enriched KEGG pathways were visualized on a bubble diagram. The size of the circle shows the number of genes, and the color of the circle corresponds to the size of the P-value.
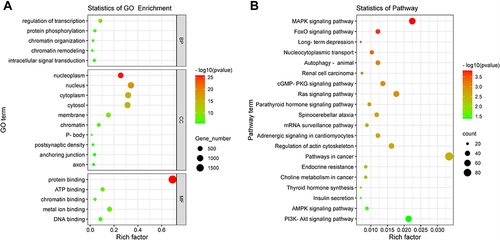
Figure 4 The expression of the two selective miRNAs (miR-320e, miR-668-5p) was validated by qRT-PCR. U6 snRNA was used as internal control for normalization. (A) The expression of plasma exosomal miR-320e from CSVD patients was clear downregulated (p<0.0001, Mann–Whitney test). (B) There are no significant differences in plasma exosomal miR-668-5p expression between CSVD and the control group (p=0.062, Mann–Whitney test). Violin plots showed the expression of exosomal miR-320e and miR-668-5p in patients and controls representatively. ****p < 0.0001, CSVD patients vs controls. The y-axis corresponds to miR-320e and miR-668-5p expression levels by log10 change. n = 150 in CSVD group, n = 80 in control group.
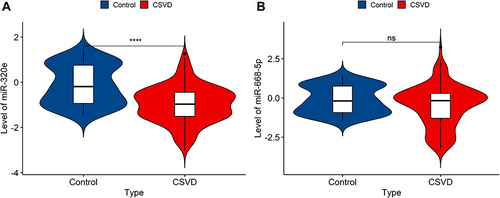
Table 3 Exosomal miR-320e and the Risk Factors
Figure 5 ROC curves of exosome-derived miR-320e and miR-668-5p in diagnosing CSVD.
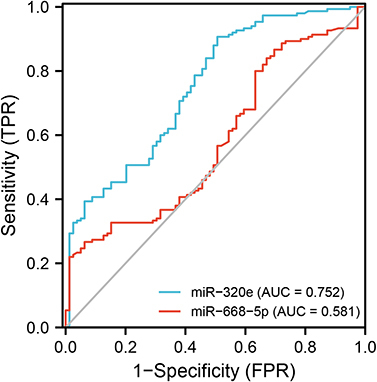
Table 4 Univariable and Multivariable Logistic Regression Analyses Between Possible Predictors and Moderate-Severe WMH
Figure 6 Distribution of mean values of miR-320e according to severity of white matter hyperintensity. (A) miR-320e level was negatively correlated with Fazekas score of PVWMH (p=0.0021, ANOVA), n=79 when Fazekas score=0 or 1, n=46 when Fazekas score=2, n=25 when Fazekas score=3; (B) miR-320e level was negatively correlated with Fazekas score of DWMH (p=0.0018, ANOVA), n=97 when Fazekas score=0 or 1, n=24 when Fazekas score=2, n=29 when Fazekas score=3, **P < 0.01, *P < 0.05.
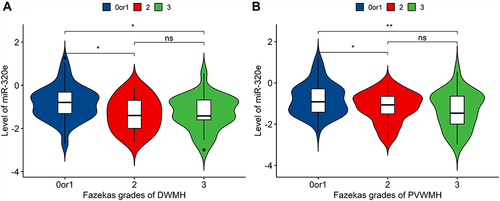
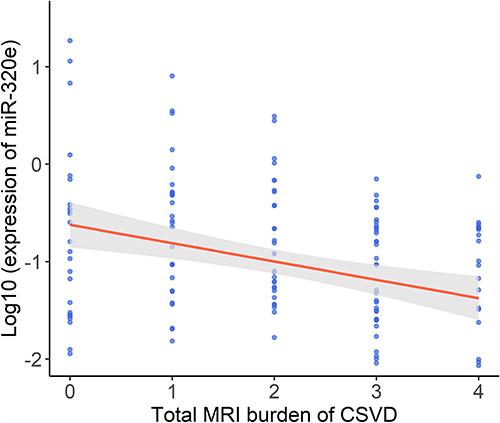
Figure 7 The correlation between exosomal miR-320e level and the total burden of CSVD. The scatter plot showing correlations between the two variables was calculated by Spearman correlation test (r=−0.276, p=0.001).