Figures & data
Table 1 Comparison of the Baseline Between the Unstable Aneurysm Group and Stable Aneurysm Group
Figure 1 Aneurysm location distribution.
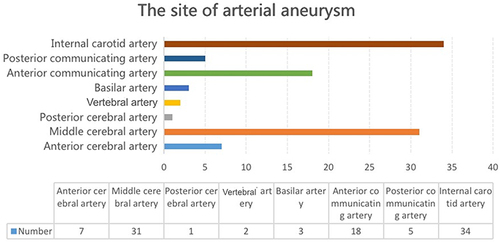
Figure 2 Violin diagram. (a) Inlet angle, p> 0.05. (b–d) Enhancement rate, AR, and SR, respectively, p< 0.05.
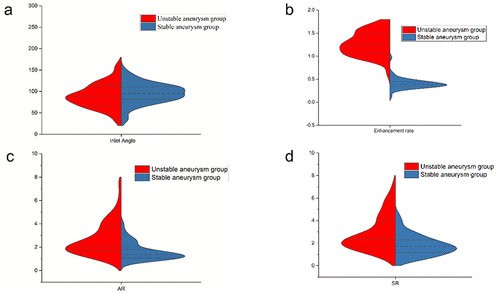
Figure 3 Female patient, 66 years old. (a–c) were images of CTA, VR, and HI-VWI respectively, which could show the aneurysm of the cavernous segment of the left internal carotid artery, and the tumor wall was significantly enhanced after enhancement. (a) is VR image of CT and the black arrow shows an aneurysm in the cavernous segment of the left internal carotid artery; (b and c) are high-resolution MRI cross-sectional and sagittal images and the black arrows show the presence of enhancement in the aneurysm wall.
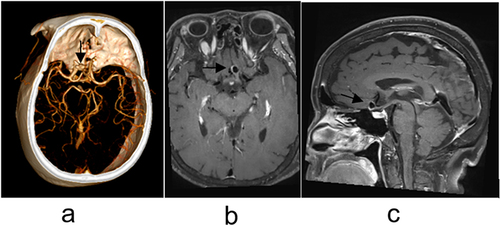
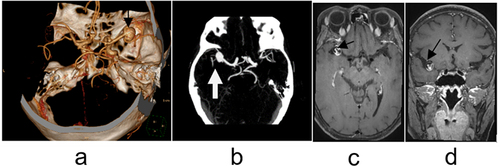
Figure 4 A 68-year-old female patient. (a–d) images of CTA VR, MIP, and HI-VWI respectively, can show the distal aneurysm of the M1 segment of the right middle cerebral artery, and the tumor wall is significantly strengthened after enhancement. In this case, the SR is 4.46. (a) is the VR image of CT and the black arrow shows the aneurysm distal to the M1 segment of the right middle cerebral artery; (b) is a CT maximal intensity projection image and the white arrow indicates the aneurysm distal to the M1 segment of the right middle cerebral artery; (c and d) are high-resolution MRI cross-sectional and coronal images, and the black arrows show the presence of enhancement in the aneurysm wall.