Figures & data
Figure 1 Screening flowchart.
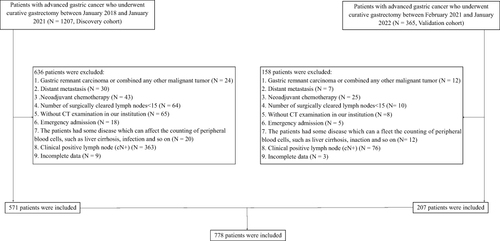
Table 1 Clinicopathological Variables of Patients with cN0 Advanced Gastric Cancer
Figure 2 (A) The ROC curve of FLR for predicting LNM in patients with cN0 AGC. (B) Receiver operating curves of the FLR and the CA199 for prediction of LNM in patients with cN0 AGC.
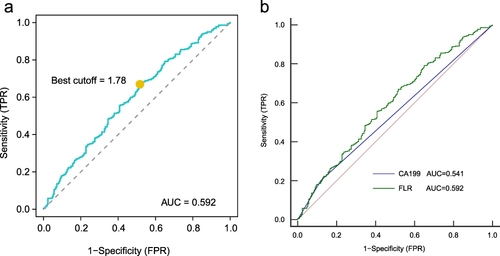
Table 2 Logistic Analyses the Predictors of Lymph Node Metastasis in Patients with cN0 Advanced Gastric Cancer
Figure 3 Distribution of FLR in terms of different clinicopathological variables. (A) T stage. (B) Tumor site. (C) Lauren type. (D) Tumor size. (E) Sex. (F) Grade. (G) CA199.
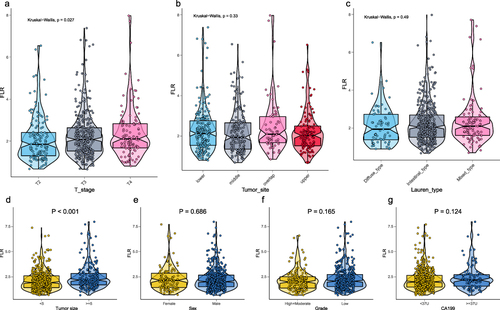
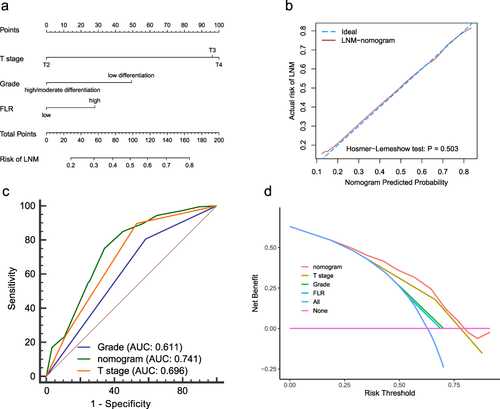
Figure 4 Development and evaluation of the nomogram for predicting LNM in patients with cN0 AGC. (A) Nomogram. (B) Calibration curves. (C) ROC curves. (D) Decision curve analysis.