
Figures & data
Table 1 Patients’ Clinic-Pathological Characteristics
Table 2 Associations Between Patients’ Characteristics and T Cell Density, CD27 and CD95 Expression
Figure 1 Representative IHC staining of CD3, CD8, CD27, and CD95 in the core of the tumor (CT) and in the tumor’s invasive margin (IM) in colon tumor tissue and in normal colon tissue (100×).
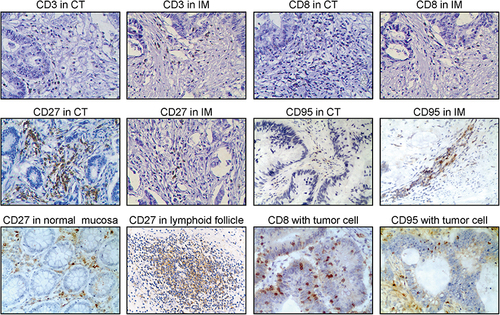
Figure 2 Representative IHC staining of CD3, CD8, and CD27 in the same place at the same time, namely in the core of the tumor (CT) and in the tumor’s invasive margin (IM) in colon tumor tissue (100×).
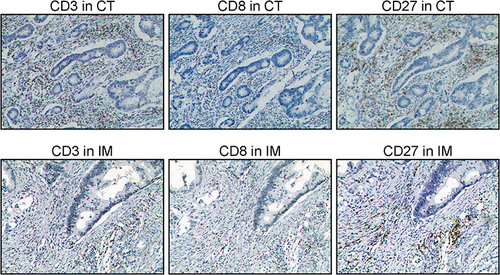
Figure 3 Kaplan–Meier curves according to T cell density, CD27, and CD95 expression and Log rank test. (A) T cell density, n (low) = 80, n (high) = 75; (B) CD27 expression, n (low) = 62, n (high) = 93; (C) CD95 expression, n (low) = 56, n (high) = 99.
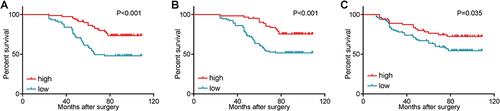
Table 3 Univariate and Multivariate Cox Regression Analysis of Survival Factors in Colon Cancer