
Figures & data
Table 1 Students’ Demographics (n=1032)
Table 2 Comorbidities of Students (n=1032)
Figure 1 Comorbidities among respondents according to gender.
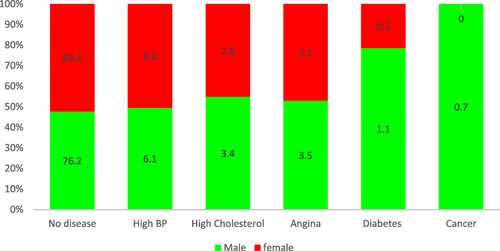
Figure 2 Combination of comorbidities according to gender.
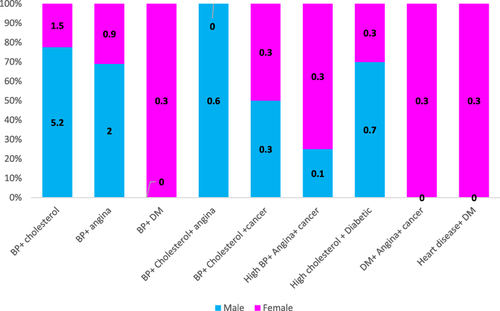
Table 3 Signs and Symptoms Persist for More Than 05 Weeks in Students (n=1032)
Table 4 Thyroid Personal and Family History (n=1032)
Figure 3 Types of thyroid disease among students.
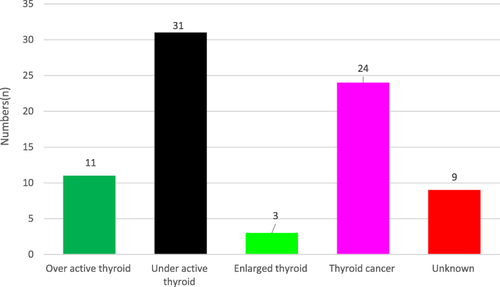
Table 5 Estimation of Thyroid Dysfunction Risk Based on Physical Assessment
Table 6 Association Between Students ‘Age and Gender in Relation to Thyroid Risk Levels
Figure 4 Association between comorbidities and thyroid risk levels.
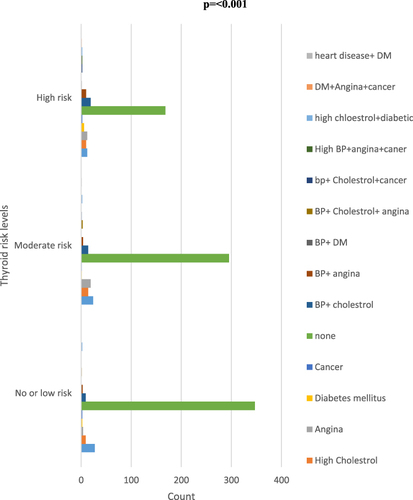
Figure 5 Association between consumption of herbal medicine versus risk levels of thyroid.
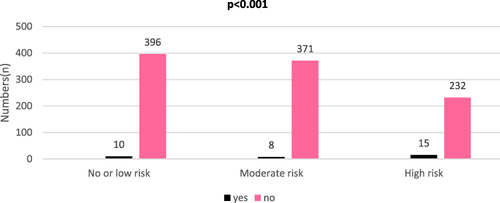
Table 7 Regression Results of Thyroid Risk with Some Demographic Features of Students