Figures & data
Table 1 Detailed Sequences of Primers
Figure 1 TRIM5 was associated with SLE. (A) Venn plot showed 14 core genes with increased expression in SLE patients from GSE121239, GSE100163, GSE61635, GSE110169, and GSE45291. (B) The logFC and adjusted P values of 14 core genes in five public datasets were shown. The heterogeneity test was under the fixed effect model. The genes were ranked by decreasing heterogeneity. (C) The correlation scores between the 14 target genes were shown. (D) The expression levels of TRIM5 were compared between cases and controls. GSE84844 and GSE100152 are for Sjogren’s syndrome and dermatomyositis, respectively.
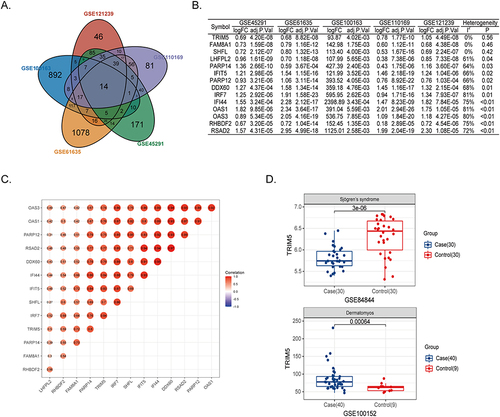
Figure 2 Expression profiles of TRIM5-high and -low groups in GSE45291. (A) The volcano plot showed differentially expressed genes (DEGs) between TRIM5 25% quartile higher samples and 25% quartile lower samples. The green dots represent DEGs with fold change <-1.5, red dots represent DEGs with fold change >1.5, adjust P <0.05. (B) Heatmap indicates the top 50 up-regulated and down-regulated DEGs significantly separate SLE and control groups. (C and D) KEGG and GO enrichment analysis. The x-axis represents the enrichment ratio, which is the ratio of the number of target genes belonging to a pathway divided by the number of all the annotated genes located in the pathway. The size of the dot indicates the number of target genes in the pathway. (E) GSEA enrichment analysis showed the “Viral protein interaction with cytokine and cytokine receptor” pathway was significantly enriched in the TRIM5-high group. (F) Receiver operating characteristic (ROC) analysis was used for assessing the diagnostic value of TRIM5 in GSE45291 (AUC score = 0.93).
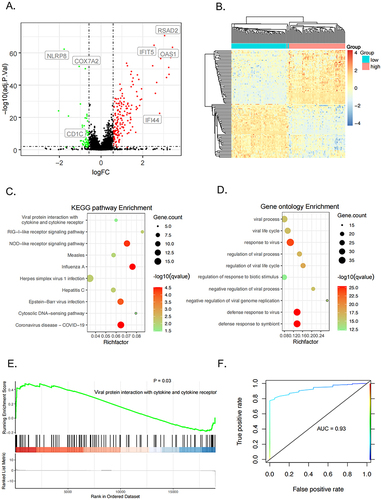
Figure 3 Expression of the top up-regulated and down-regulated genes. The gene expression levels of (A) IFI44, (B) RSAD2, (C) SLC26A11, (D) CD1C, (E) SLC25A6 and (F) HERC5 in TRIM5-higher and TRIM5-lower group of SLE patients. *P <0.05, **P<0.01 by Student’ t-test.
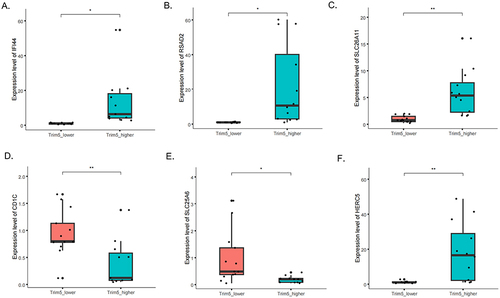
Figure 4 Differential expression of 5 selected genes (RSAD2, IFI44, IFIT5, OAS3, and OAS1) in TRIM5-lower, TRIM5-higher, SLE, and control groups from three datasets. (A-C) Differential expression of RSAD2, (D-F) Differential expression of IFI44, (G-I) Differential expression of IFIT5, (J-L) Differential expression of OAS3, (M-O) Differential expression of OAS1. The X-axis represents different groups, and the Y-axis represents the gene expression levels of selected genes. GSE110169 (left), GSE61635 (middle) and GSE45291 (right) were shown. **P<0.01, ***P<0.001, ****P<0.0001 by Student’ t-test.
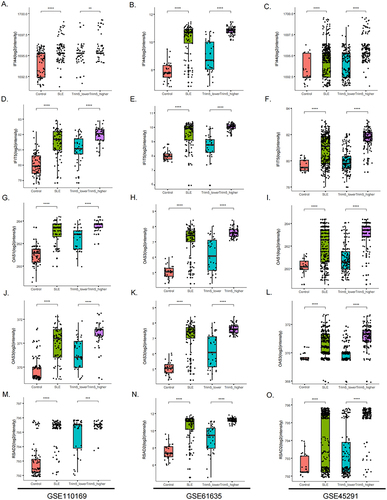
Figure 5 Immune cell enrichment analysis in three selected GSE files. (A) X-axis represents GSE datasets, Y-axis indicates the proportions of naive CD4(+) T cells (left), M2 macrophages (middle), and immune scores (right). Blue bins represent cases, and red represent healthy controls. (B) X-axis showed the expression levels of TRIM5, Y-axis represents the proportion of naive CD4(+) T cells in GSE110169 (left), GSE121239 (middle), and GSE45291 (right). The blue dots represent the case group, and the red dots represent the control group. (C) X-axis showed the expression levels of TRIM5, Y-axis represents the proportion of M2 macrophages in GSE110169 (left), GSE121239 (middle), and GSE45291 (right). The blue dots represent the case group, and the red dots represent the control group.
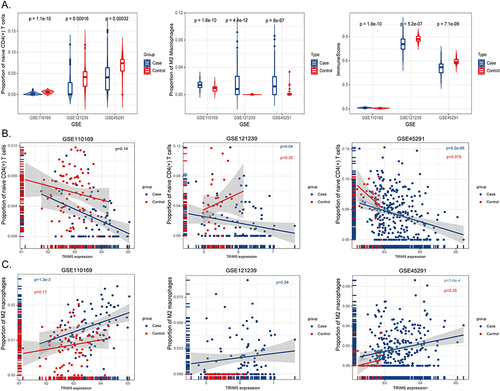
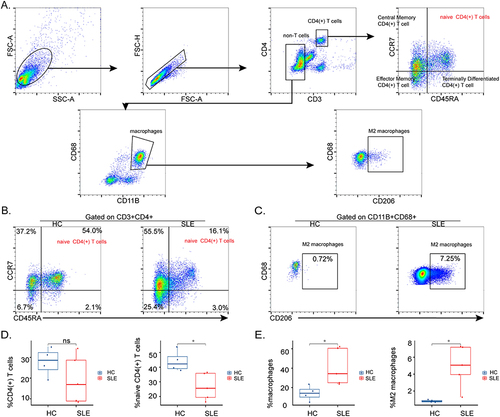
Figure 6 Proportions of naive CD4(+) T cells and M2 macrophages in PBMCs of SLE and control groups. (A) The gating strategy for naive CD4(+) T cells and M2 macrophages in PBMCs. CD4(+) T cells: CD3+CD4+; naive CD4(+) T cells: CD3+CD4+CD45RA+CCR7+; macrophages: CD11B+CD68+; M2 macrophages: CD11B+CD68+CD206+. Representative flow cytometry plots show naïve CD4(+) T cells (B) and M2 macrophages (C) of PBMCs in HCs (n = 4) and SLE (n = 5). Absolute numbers of CD4(+) T cells, naive CD4(+) T cells (D), and macrophages, M2 macrophages (E). *P < 0.05.