
Figures & data
Table 1 Top 10 Up- and Down-Regulated DEmRNAs, DEmiRNAs and DElncRNAs
Figure 1 The hierarchical clustering results of top 100 up- and down-regulated DEmRNAs (A), all DEmiRNAs (B) and all DElncRNAs (C) between the early and late stage HCC. Row and column represented DEmRNAs/DEmiRNAs/DElncRNAs and samples, respectively. The color scale represented the expression levels. Orange indicates above the reference channel (high expression genes). Blue indicates below the reference channel (low expression genes).
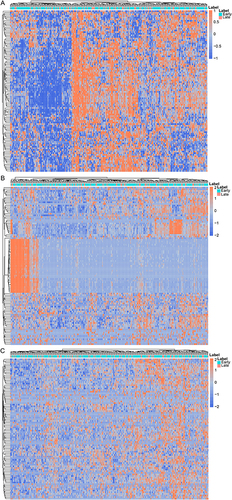
Figure 2 GSEA analysis illustrated up-regulated gene sets in the late stage HCC. (A) G2M_checkpoint; (B) mitotic_spindle.
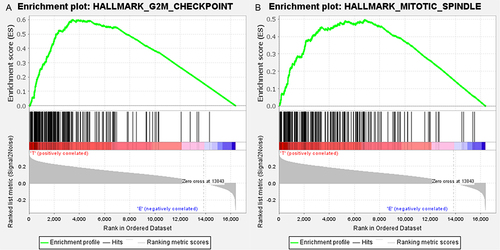
Figure 3 DElncRNA-DEmiRNA-DEmRNA regulatory network. The rectangle, inverted triangles and elliptical nodes indicate DElncRNAs, DEmiRNAs and DEmRNAs, respectively. Red and blue color represent up- and down-regulation, respectively.
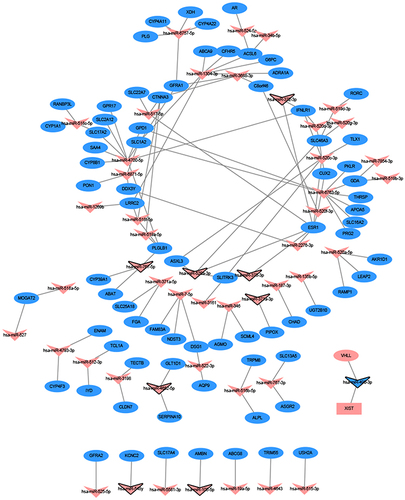
Figure 4 Nomogram (A) and calibration curve (B) in HCC.
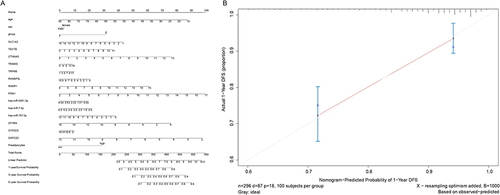
Figure 5 RT-qPCR results of DEmRNAs and DEmiRNAs.
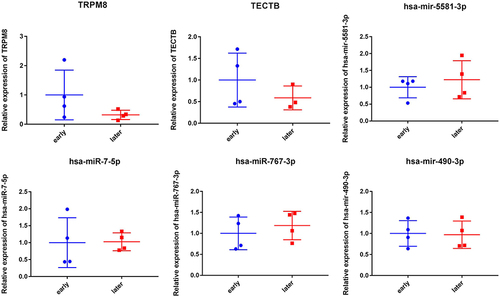
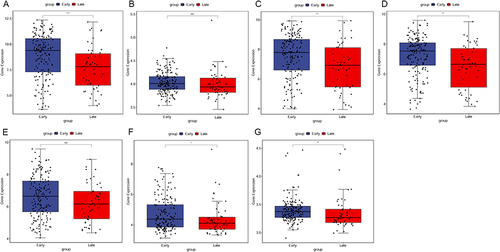
Figure 6 Validation of DEmRNAs in GSE14520. (A) CFHR4, (B) CTNNA3, (C) CYP2C9, (D) PON1, (E) RAMP1, (F) SLC1A2, (G) TRPM8.
Data Sharing Statement
All data generated or analyzed during this study are included in this published article. We searched for HCC public gene expression data and complete clinical annotations from TCGA (https://tcga-data.nci.nih.gov/tcga/) database. The accession numbers is TCGA: HCC (Platform: Illumina RNAseq), respectively. The raw data of RT-qPCR validation has been deposited in the Harvard Dataverse database (https://doi.org/10.7910/DVN/I8L6QI).