Figures & data
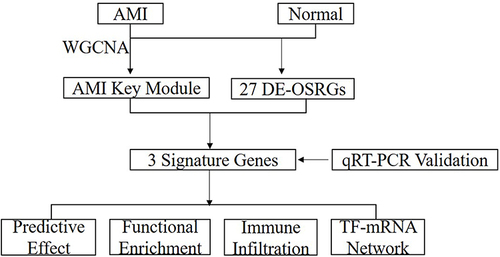
Table 1 Real-Time qPCR Primers
Figure 1 Differentially Expressed Oxidative Stress-Related Genes (DE-OSRGs) and Functional Enrichment Analysis in AMI and Normal Samples. (A and B) Total of 60 differentially expressed genes identified between AMI and normal samples using the GSE48060 dataset, which includes 21 upregulated genes and 39 downregulated genes. (C) Identification of 27 DE-OSRGs by overlapping the 60 differentially expressed genes with 9438 OSRGs. (D) Top 10 Gene Ontology (GO) terms, showing that these DE-OSRGs are significantly enriched in the biological processes of negative regulation of T cell-mediated immunity, cell lysis, and cytotoxicity. (E) Kyoto Encyclopedia of Genes and Genomes (KEGG) analysis revealing that the graft-versus-host disease and natural killer cell-mediated cytotoxicity signaling pathways are associated with DE-OSRGs.
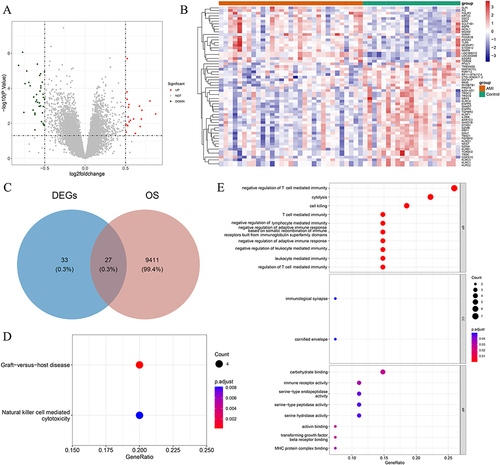
Figure 2 Protein-Protein Interaction (PPI) Network Analysis of DE-OSRGs in AMI. The PPI network, comprised of 17 nodes and 37 edges, represents the interactions among the 27 DE-OSRGs. Key interactions between GZMB and multiple proteins, and S100A12 and a set of proteins, are highlighted.
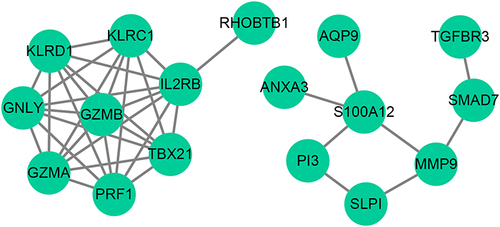
Figure 3 Key Module Genes Related to AMI Identified by Weighted Gene Co-expression Network Analysis (WGCNA). (A and B) Following the exclusion of two outlier samples, the remaining 50 samples were processed. (C) Construction of a scale-free network with a soft threshold β=18. (D) A total of 14 gene modules obtained from a clustering dendrogram, using a dynamic tree-cutting algorithm. (E) Correlation analysis revealing two modules, black and salmon, highly related to AMI.
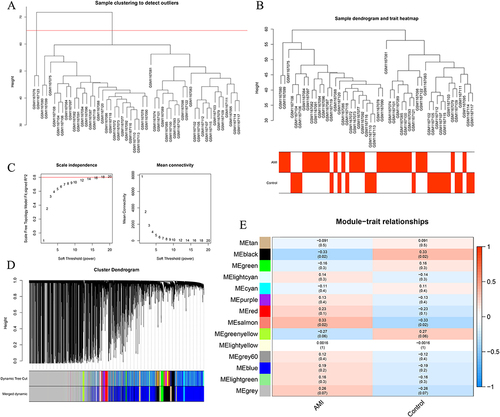
Figure 4 Identification of Signature Genes. (A) Overlapping the 27 DE-OSRGs with 3054 key module genes to obtain 6 candidate genes. (B and C) Results derived from LASSO regression and the SVM algorithm. (D) Five identified signature genes—MMP9, TGFBR3, DSC2, SMAD7, and S100A12.
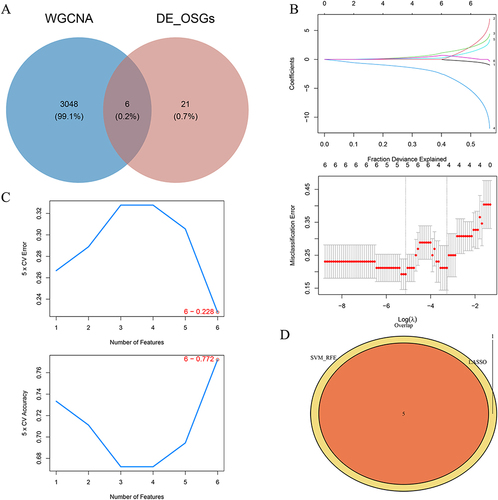
Figure 5 ROC Curve Evaluation and Expression Validation of Key Genes. (A) ROC curve analysis demonstrating the diagnostic capabilities of MMP9, TGFBR3, and S100A12 in the GSE48060 (training set) and GSE60993 (validation set) datasets. (B) Expression validation of MMP9, TGFBR3, and S100A12 in both datasets, showing significant upregulation of MMP9 and S100A12, and downregulation of TGFBR3 in the LDH group.
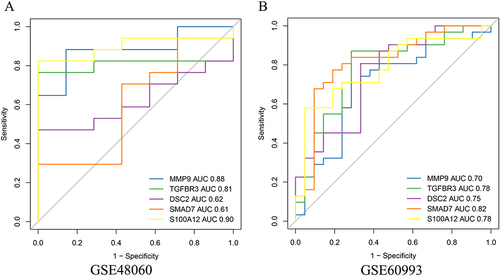
Figure 6 Gene Set Enrichment Analysis (GSEA) of Key Genes. (A–C) Enrichment of key genes in the biological process of ribosomal structural components, with associated signaling pathways also showing significant involvement of these key genes.
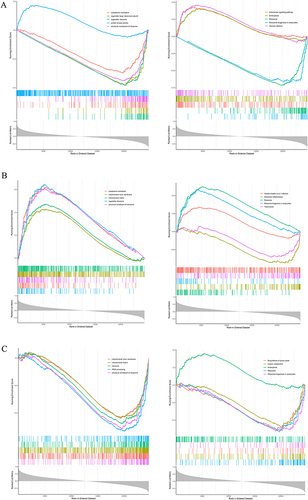
Figure 7 Analysis of Immune Microenvironment and Correlation between Key Genes and Differential Immune Cells. (A) Calculation of proportions of 22 infiltrating immune cells in AMI and normal groups using the CIBERSORT algorithm. (B) Analysis showing that resting NK cells were more abundant in the normal group, while monocytes and M0 macrophages were more prevalent in the AMI group. (C) Correlation analysis revealing positive correlation of MMP9 with M0 macrophages and S100A12 with both monocytes and M0 macrophages, and a negative correlation of TGFBR3 with monocytes.
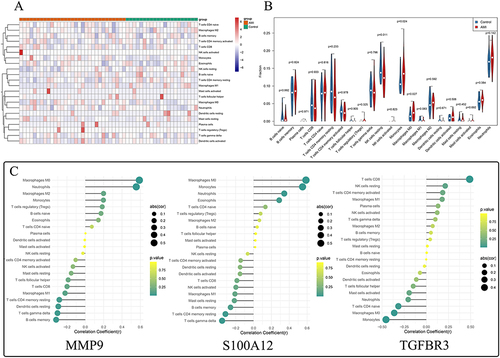
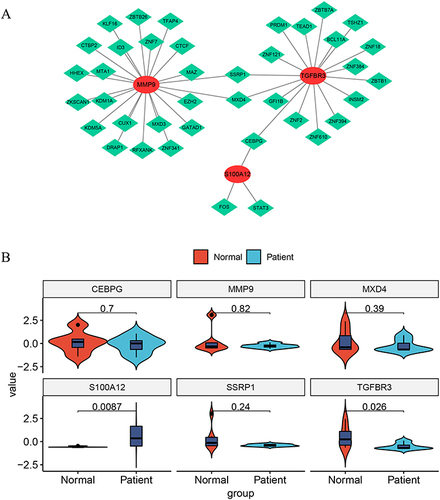
Figure 8 Transcription Factor (TF)-mRNA Network Based on AMI Key Genes. (A) The network, comprised of 42 nodes (39 transcription factors and 3 key genes) and 45 edges, shows the regulatory relationships of key genes. MMP9 is regulated by 22 transcription factors, TGFBR3 by 17 transcription factors, and S100A12 by three transcription factors (FOS, STAT3, and CEBPG). This diagram illustrates the complex interplay of these factors in the pathogenesis of AMI. (B) The expression of each of the three key genes and core transcription factors was validated by qPCR.