
Figures & data
Figure 1 The flow chart of the research. Abbreviations are defined as follows.
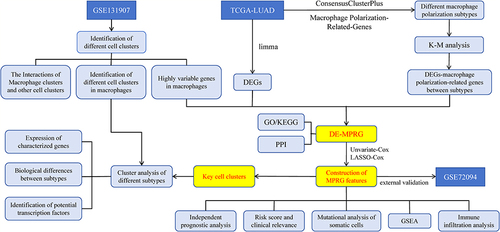
Figure 2 Highly variable gene screening and cell clustering of LUAD scRNA-seq data from GSE131907. (A) 2000 highly variable genes. (B) PCA results. (C-D) P-value of first 50 principal components (PCs). (E) Cluster diagram of the core cells. (F) Heatmap showing the top 5 marker genes in each cell cluster. (G) 23 cell clusters were annotated into 9 cell types. (H) CellChat diagram of each cell type.
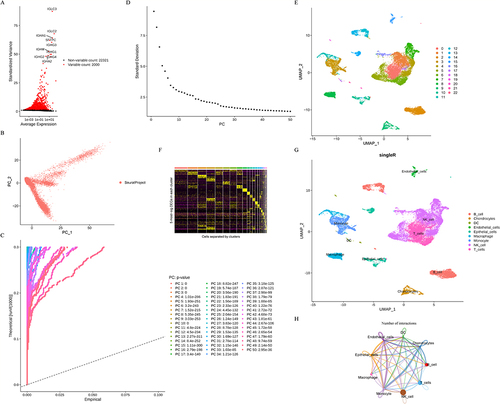
Figure 3 Identification of macrophage polarization-related subtypes of TCGA-LUAD samples. (A) Cumulative distribution function (CDF) curve of K=2-9. (B) The relative change in area under the CDF curve of K=2-9. (C) The consensus matrix heatmap of K=2. (D) Kaplan-Meier survival curves of the two subtypes. (E-F) Volcano plot and heat map representing DEGs (|log2FC|>0.5, adj.P-value<0.05) in the two subtypes. (G-H) Volcano plot and heat map of DEGs (|log2FC|>0.5, adj.P-value<0.05) between TCGA normal and LUAD samples.
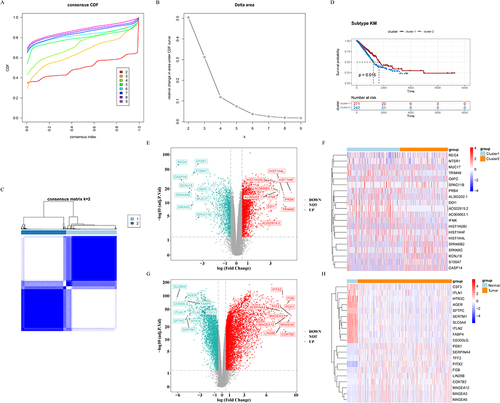
Figure 4 KEGG and GO analysis of differentially expressed and highly mutated MPRGs. (A) Venn diagram showing the 28 genes obtained by intersecting. (B) GO terms on BP, CC and MF levels enriched for the crossover genes. (C) KEGG pathways enriched for the 28 genes obtained. (D) PPI network of 26 intersecting genes.
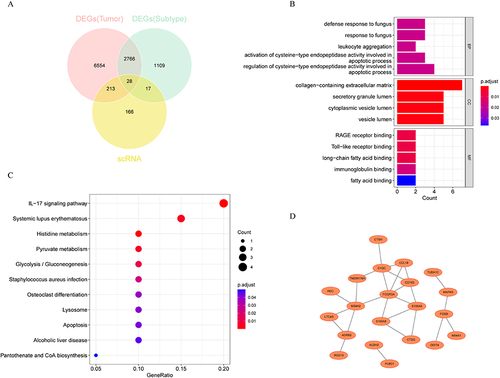
Figure 5 Construction and validation of differentially expressed and highly mutated MPRGs associated with LUAD. (A) Univariate Cox regression analysis of the TCGA-LUAD screened the differentially expressed and highly mutated MPRGs associated with LUAD. (B) 7 genes were further screened by LASSO regression analysis. The trajectory of each independent variable and the confidence interval under each lambda were showed. (C) Predictive value of 7 characteristic genes for LUAD in TCGA training set. (D) Predictive value of 7 characteristic genes for LUAD in GSE72094 validation set.
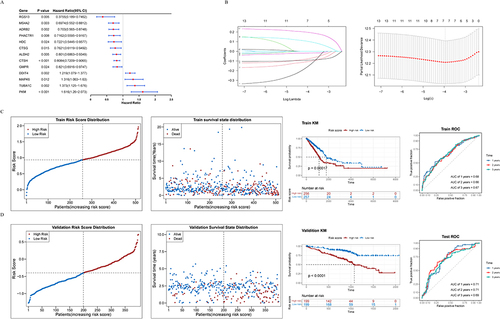
Figure 6 Construction of a nomogram model based on the 7 characteristic genes for LUAD. (A-B) Univariate and multifactorial Cox analysis of the TCGA-LUAD cohort. (C) Probabilistic nomogram for predicting 1-, 2-, and 3-year survival probability of patients with LUAD. (D) Calibration plot for conformance testing between 1–3 years survival predictions and actual outcomes. (E) Time-dependent ROC curve showing the risk score had significant prognostic value.
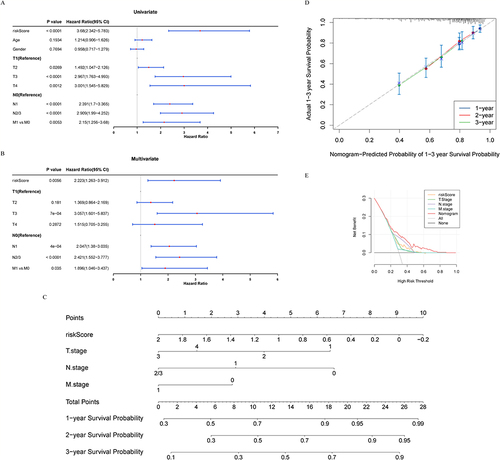
Figure 7 Mutated genes analysis and immune infiltration analysis in the high/low-risk groups. (A) Matrix heatmaps of the correlation analysis results. (B) GSEA enrichment analysis of high/low-risk groups. (C) Violin plots depicting differential analysis of immune cells in different risk groups. ****p<0.0001, ***p<0.001, *p<0.05.
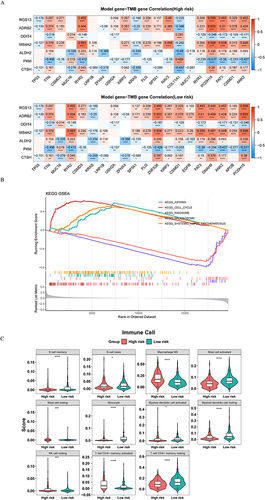
Figure 8 Reannotation and analysis of the macrophage clusters. (A) Five clusters were identified after further annotation. (B) Expression of characteristic genes in different cell clusters. (C) Pseudotime analysis of the macrophage clusters. (D) Cell annotation for the pseudotime analysis.
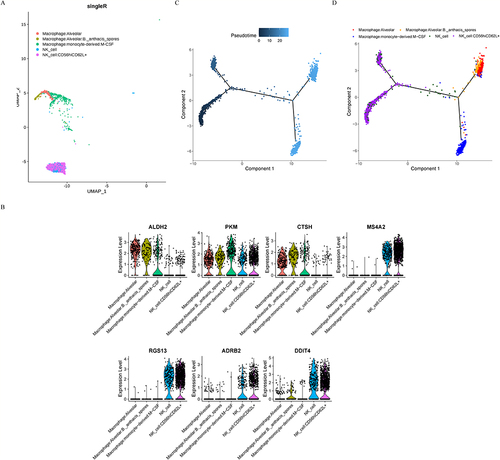
Figure 9 Expression and function of characteristic genes in macrophage types cell clusters. (A) Key cells from three macrophage-type-cell clusters were divided into two subpopulations. (B) Expression of characteristic genes in different cell subpopulations. (C-D) GSEA enrichment analysis of two subpopulations. ***p<0.001, **p<0.01, NS≥0.05.
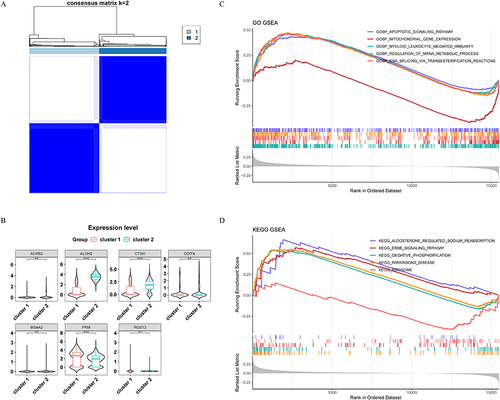
Figure 10 Identification of transcription factors of characteristic genes. (A) The top 10 TFs with the highest regulon specificity score in each subgroup. (B) Expression of the top 10 TFs in each cell cluster. (C) Expression of BCLAF1 and MAX in two subgroups. ****p<0.0001, **p<0.01.
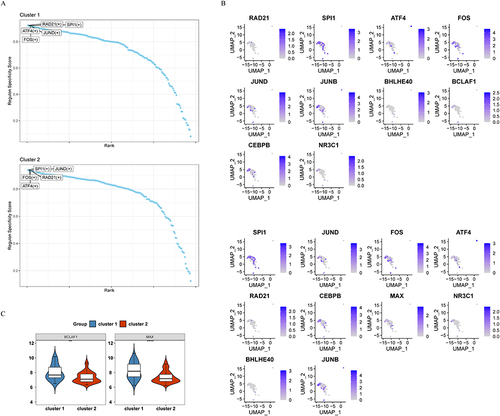
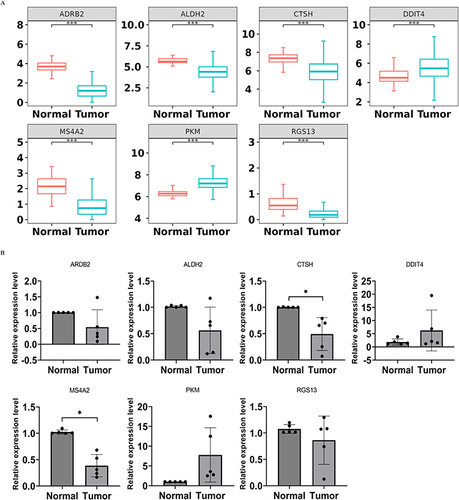
Figure 11 Relative mRNA expression levels of 7-MPRGs in TCGA-database and clinical samples. (A) Differential expression in TCGA-LUAD-database. (B) Differential expression in five paired LUAD tissues and adjacent non-tumor lung tissues. ***p<0.001, *p<0.05.
Data Sharing Statement
The authors confirm that the data supporting the findings of this study are available within the article and its Supplementary Materials.