Figures & data
Figure 1 Expression of CD1A in COAD and Across Various Cancer Types. (A) Differential expression of CD1A in multiple tumor types as indicated by the GENT2 database. (B) Evaluation of CD1A expression levels across different tumor types using the TIMER database. (C) Comparative analysis of CD1A expression in COAD versus normal tissues in the TCGA database. (D) Analysis of CD1A expression in COAD compared to paired normal tissues using the TCGA database. (E) Examination of CD1A expression differences between COAD and normal tissues using the GSE21510 dataset. (F) Assessment of CD1A expression in COAD versus normal tissues using the GSE22598 dataset. (G) Investigation of CD1A expression in COAD relative to normal tissues with the GSE37364 dataset. (H) Analysis of CD1A expression in COAD cell lines (SW480 and HCT116) and normal human colon epithelial cell line (HCoEpiC).
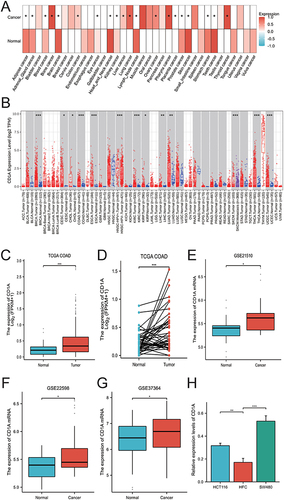
Table 1 Correlation Analysis of CD1A mRNA Expression with Clinicopathological Features in the TCGA COAD Cohort
Figure 2 Analysis of CD1A’s biological functions in COAD. (A) Identification of genes significantly associated with CD1A in COAD. (B) Heatmap illustrating the top 50 genes positively correlated with CD1A in COAD. (C) Heatmap depicting the top 50 genes negatively correlated with CD1A in COAD. (D) GO functional annotation analysis for genes co-expressed with CD1A. (E) KEGG pathway enrichment analysis for genes co-expressed with CD1A. (F) Protein-protein interaction network involving CD1A.
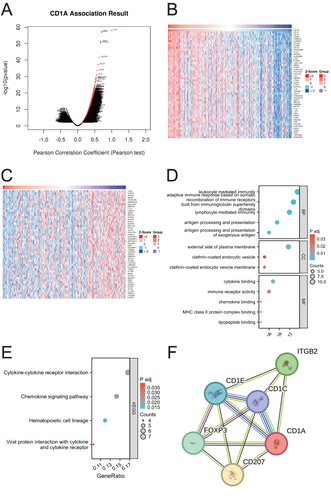
Figure 3 Correlation between CD1A Expression and Immune Cell Infiltration in COAD. (A) Significant correlation of CD1A expression with the infiltration levels of B cells, CD8+ T cells, CD4+ T cells, macrophages, neutrophils, and dendritic cells in COAD. (B) Impact of CD1A CNV on the infiltration levels of CD8+ T cells, B cells, and dendritic cells in COAD. (C) Comparative analysis of immune cell subtype proportions in groups with high versus low CD1A expression.
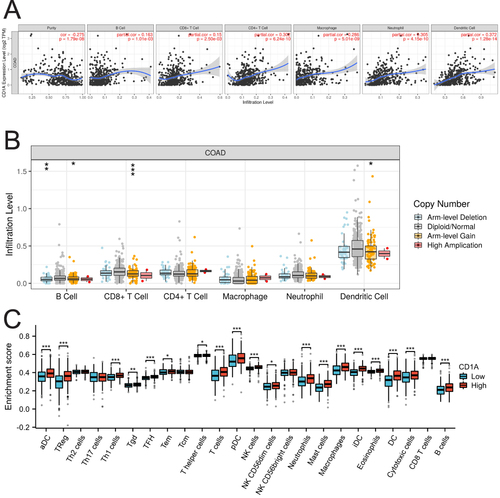
Table 2 Analysis of the Correlation Between CD1A and Immunological Markers of Immune Cells
Figure 4 Correlation between CD1A expression and m6A-related genes in COAD. (A-F) Correlation analysis between CD1A expression and FTO, HNRNPA2B1, IGF2BP2, METTL3, RBM15 and RBMX. (G) Differences in the expression of m6A-related genes between CD1A high-expression and low-expression groups in COAD.
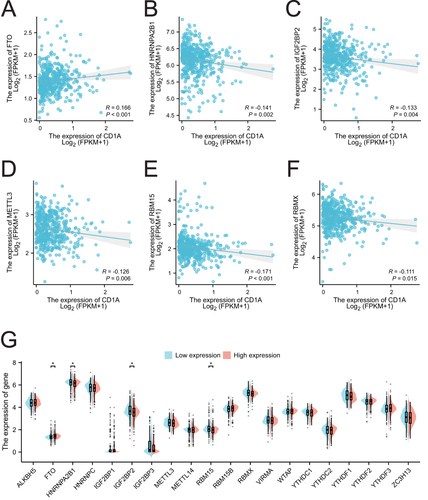
Figure 5 Correlation analysis of CD1A with target miRNAs. (A) Correlation analysis of CD1A expression with hsa-miR-33b-5p expression. (B) Correlation analysis of CD1A expression with that of hsa-miR-516b-5p. (C) Correlation analysis of CD1A expression with that of hsa-miR-589-3p.
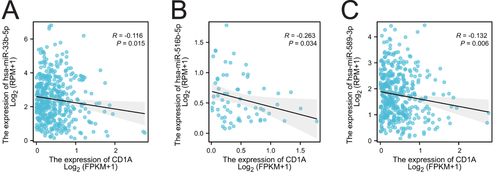
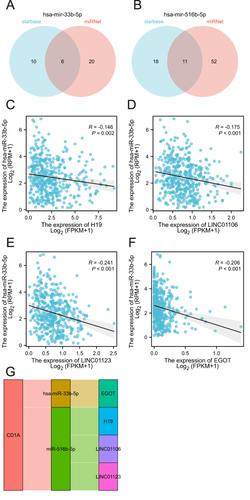
Figure 6 CeRNA network construction of CD1A in COAD. (A) Prediction of target lncRNA of has-miR-33b-5p using starbase and miRNet. (B) Prediction of target lncRNA of has-miR-33b-5p using starbase and miRNet. (C-F) Correlation analysis of miRNAs with targeted lncRNAs. (G) Sankey diagram showing the lncRNA-miRNA-mRNA regulatory network of CD1A.