Figures & data
Table 1 The compositions of the amphiphilic copolymers produced
Figure 1 FT-IR spectra of AAPBA, DEGMA, p(AAPBA), and PAD-5-1.
Note: PAD-5-1, p(AAPBA-b-DEGMA) (pAAPBA:DEGMA =1:5).
Abbreviations: AAPBA, 3-acrylamidophenylboronic acid; DEGMA, diethylene glycol methyl ether methacrylate; p(AAPBA), poly(3-acrylamidophenylboronic acid); FTIR, Fourier transform infrared spectroscopy.
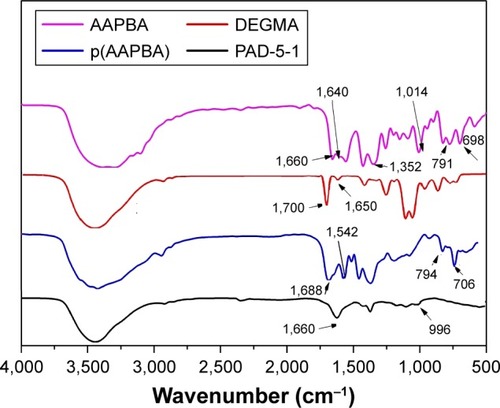
Figure 2 1H-NMR spectra of (A) DEGMA, (B) AAPBA, (C) p(AAPBA), and (D) PAD-5-1.
Notes: PAD-5-1, p(AAPBA-b-DEGMA) (pAAPBA:DEGMA =1:5). Peaks crossed through correspond to the solvents used for NMR.
Abbreviations: 1H-NMR, 1H nuclear magnetic resonance; AAPBA, 3-acrylamidophenylboronic acid; DEGMA, diethylene glycol methyl ether methacrylate; p(AAPBA), poly(3-acrylamidophenylboronic acid).
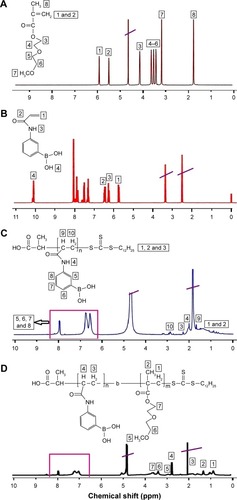
Figure 3 Thermal analysis of p(AAPBA) and PAD-5-1, showing (A) DTG and (B) TG curves.
Note: PAD-5-1, p(AAPBA-b-DEGMA) (pAAPBA:DEGMA =1:5).
Abbreviations: DEGMA, diethylene glycol methyl ether methacrylate; DTG, derivative thermogravimetric; p(AAPBA), poly(3-acrylamidophenylboronic acid); TG, thermogravimetric.
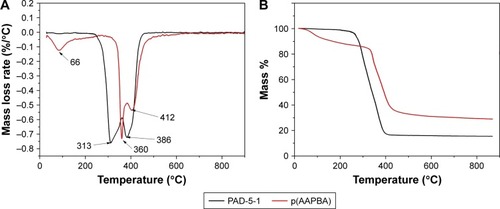
Table 2 The molecular weights (Mw and Mn) and molecular weight distributions (PDI) of the copolymers prepared in this work
Figure 4 Images of the p(AAPBA-b-DEGMA) NP suspensions (1) and TEM micro-graphs of the dried NPs (2).
Notes: (A) PAD-50-1, (B) PAD-20-1, (C) PAD-10-1, (D) PAD-5-1, and (E) PAD-2-1. PAD-X-Y, p(AAPBA-b-DEGMA) with DEGMA:pAAPBA molar ratios of X:Y.
Abbreviations: DEGMA, diethylene glycol methyl ether methacrylate; NP, nanoparticle; p(AAPBA), poly(3-acrylamidophenylboronic acid); TEM, transmission electron microscopy.
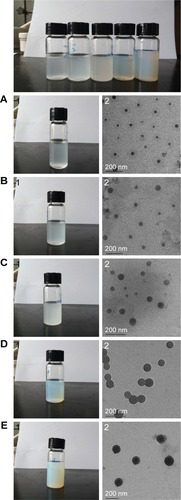
Table 3 The LCSTs, zeta potentials, and polydispersity indices of the copolymer NPs
Figure 5 The hydrodynamic diameters of copolymer NPs at different (A) pH and (B) temperatures.
Note: PAD-X-Y, p(AAPBA-b-DEGMA) with DEGMA:pAAPBA molar ratios of X:Y.
Abbreviations: DEGMA, diethylene glycol methyl ether methacrylate; NP, nanoparticle; p(AAPBA), poly(3-acrylamidophenylboronic acid); T, temperature.
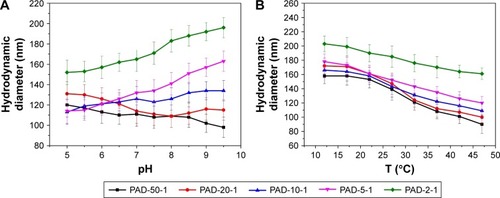
Figure 6 Changes in the size of the p(AAPBA-b-DEGMA) NPs as a function of immersion time (t) in pH 7.4 PBS solutions of glucose.
Notes: (A) PAD-50-1; (B) PAD-20-1; (C) PAD-10-1; (D) PAD-5-1; and (E) PAD-2-1 are shown. The left images show the hydrodynamic diameters, while those on the right give I/I0 (the light scattering intensity of the glucose-treated NP suspensions divided by the scattering intensity of the particles without glucose treatment). I/I0 values reflected the extent of swelling. PAD-X-Y, p(AAPBA-b-DEGMA) with DEGMA:pAAPBA molar ratios of X:Y.
Abbreviations: DEGMA, diethylene glycol methyl ether methacrylate; NP, nanoparticle; p(AAPBA), poly(3-acrylamidophenylboronic acid); PBS, phosphate-buffered saline.
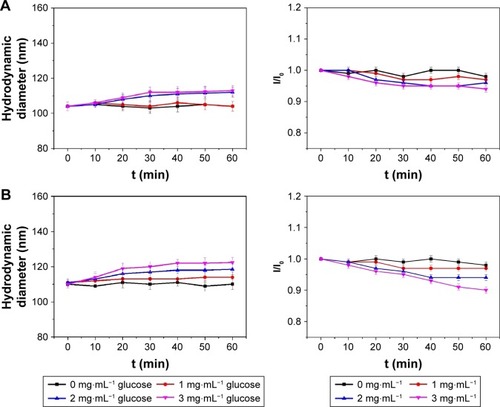
Table 4 Insulin LCs and EEs of PAD-5-1 NPs
Figure 7 In vitro release of the insulin-loaded I-L-4 particles in PBS (pH 7.4) at different (A) temperatures and (B) glucose concentrations.
Note: I-L-4, insulin-loaded NPs prepared from a 1 mg·mL−1 insulin solution.
Abbreviations: NP, nanoparticle; PBS, phosphate-buffered saline.
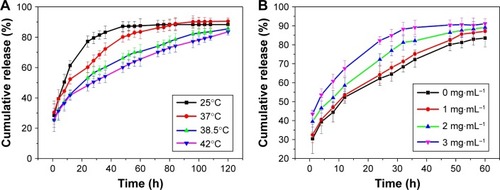
Figure 8 Cell viability as a function of the concentration of p(AAPBA-b-DEGMA) NPs, as assessed using the MTT assay at 37°C after 24 h exposure.
Notes: The data are expressed as mean ± SD from five independent experiments, with three replicates per experiment. PAD-X-Y, p(AAPBA-b-DEGMA) with DEGMA:pAAPBA molar ratios of X:Y. The concentration refers to the initial concentration of the NP suspension; the final concentration in culture is one-third of this value.
Abbreviations: DEGMA, diethylene glycol methyl ether methacrylate; NP, nano-particle; p(AAPBA), poly(3-acrylamidophenylboronic acid); SD, standard deviation.
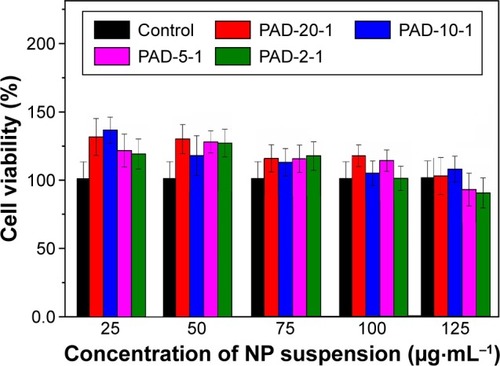
Table 5 Blood biochemical markers measured after injection of the PAD-5-1 NPs into mice for 60 days (n=5, mean ± SD)
Figure 9 Representative HE staining images (200× magnification) from the (A) liver, (B) lung, (C) spleen, (D) kidney, and (E) heart with images marked (1) denoting the negative control group, and the observation groups were given (2) 10, (3) 20, and (4) 40 mg·kg−1·d−1 of PAD-5-1 by IP injection.
Note: PAD-5-1, p(AAPBA-b-DEGMA) (pAAPBA:DEGMA =1:5).
Abbreviations: DEGMA, diethylene glycol methyl ether methacrylate; HE, hematoxylin–eosin; IP, intraperitoneal; p(AAPBA), poly(3-acrylamidophenylboronic acid).
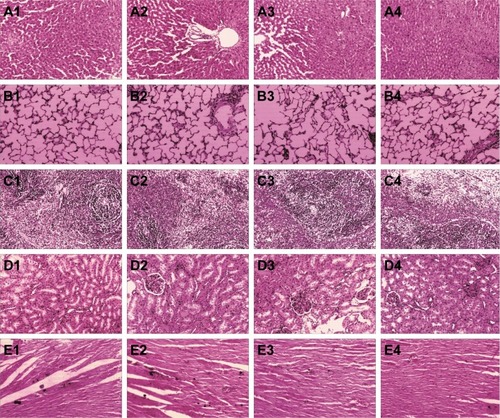
Figure 10 Blood glucose concentrations after the treatment of diabetes mellitus mice with insulin formulations.
Notes: The control group comprised normal mice, and the NPs group animals treated with insulin-loaded PAD-5-1 [I-L-4]. I-L-4 nanoparticles were prepared using a 1 mg·mL−1 insulin solution; PAD-5-1, p(AAPBA-b-DEGMA) (pAAPBA:DEGMA =1:5).
Abbreviations: DEGMA, diethylene glycol methyl ether methacrylate; NP, nanoparticle; p(AAPBA), poly(3-acrylamidophenylboronic acid).
![Figure 10 Blood glucose concentrations after the treatment of diabetes mellitus mice with insulin formulations.Notes: The control group comprised normal mice, and the NPs group animals treated with insulin-loaded PAD-5-1 [I-L-4]. I-L-4 nanoparticles were prepared using a 1 mg·mL−1 insulin solution; PAD-5-1, p(AAPBA-b-DEGMA) (pAAPBA:DEGMA =1:5).Abbreviations: DEGMA, diethylene glycol methyl ether methacrylate; NP, nanoparticle; p(AAPBA), poly(3-acrylamidophenylboronic acid).](/cms/asset/c2bc0dd5-92a9-4803-a3fc-a85a58f29e98/dijn_a_132984_f0010_c.jpg)
Figure S1 IR spectra of PAD-50-1, PAD-20-1, PAD-10-1, and PAD-2-1, recorded in the form of a KBr tablet (sample:KBr mass ratio 1:100).
Note: PAD-X-Y, p(AAPBA-b-DEGMA) with DEGMA:pAAPBA molar ratios of X:Y.
Abbreviations: DEGMA, diethylene glycol methyl ether methacrylate; IR, infrared; p(AAPBA), poly(3-acrylamidophenylboronic acid).
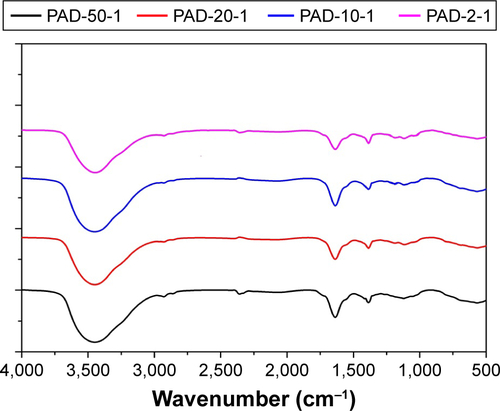
Figure S2 1H-NMR spectra of PAD-50-1 (NaOD/D2O, pH 9.5), PAD-20-1 (NaOD/D2O, pH 9.5), PAD-10-1 (NaOD/D2O, pH 9.5), and PAD-2-1 (NaOD/D2O, pH 9.5).
Notes: Peaks crossed through correspond to the solvents used for NMR. PAD-X-Y, p(AAPBA-b-DEGMA) with DEGMA:pAAPBA molar ratios of X:Y.
Abbreviations: 1H-NMR, 1H nuclear magnetic resonance; DEGMA, diethylene glycol methyl ether methacrylate; p(AAPBA), poly(3-acrylamidophenylboronic acid).
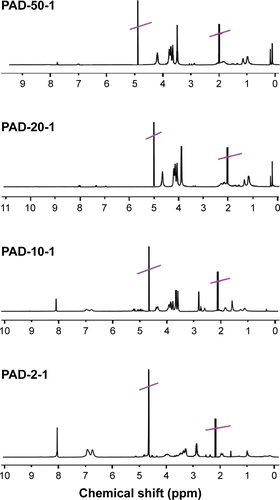
Figure S3 DTG (left) and TG (right) data for PAD-50-1, PAD-20-1, PAD-10-1, and PAD-2-1.
Note: PAD-X-Y, p(AAPBA-b-DEGMA) with DEGMA:pAAPBA molar ratios of X:Y.
Abbreviations: DEGMA, diethylene glycol methyl ether methacrylate; DTG, derivative thermogravimetric; p(AAPBA), poly(3-acrylamidophenylboronic acid); TG, thermogravimetric.
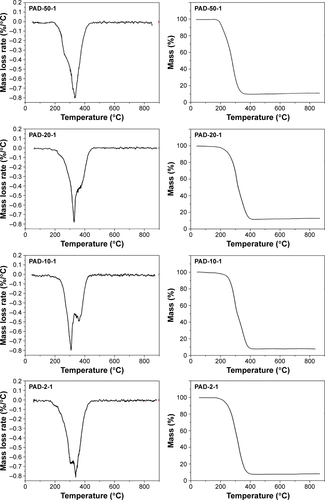
Figure S4 (A) The stability of blank p(AAPBA-b-DEGMA) NPs in pH 7.4 PBS and (B) their reversible glucose sensitivity.
Note: PAD-X-Y, p(AAPBA-b-DEGMA) with DEGMA:pAAPBA molar ratios of X:Y.
Abbreviations: DEGMA, diethylene glycol methyl ether methacrylate; NP, nanoparticle; p(AAPBA), poly(3-acrylamidophenylboronic acid); PBS, phosphate-buffered saline.
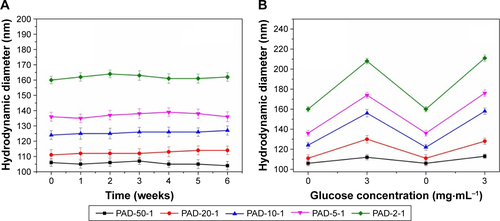
Figure S5 In vitro release of insulin into pH 7.4 PBS at different temperatures for (A) I-L-1, (B) I-L-2, (C) I-L-3, and (D) I-L-5 insulin-loaded NPs.
Abbreviations: I-L, insulin loading; NP, nanoparticle; PBS, phosphate-buffered saline.
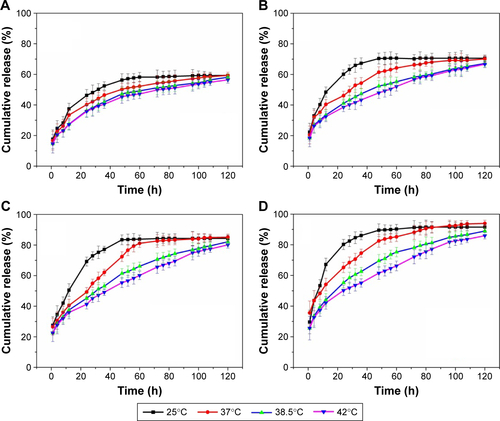
Figure S6 In vitro release of insulin from I-L-4 into PBS (pH 7.4) at various glucose concentrations at (A) 25, (B) 38.5, and (C) 42°C.
Abbreviations: I-L, insulin loading; PBS, phosphate-buffered saline.
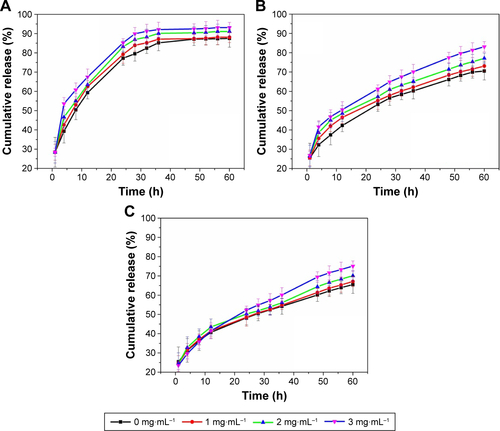
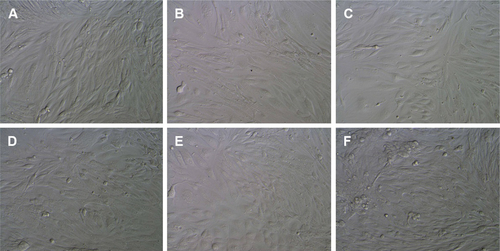
Figure S7 Digital photographs (400× magnification) of NIH 3T3 cells after treatment with PAD-5-1 NPs.
Notes: (A) Untreated cells and cells treated with (B) 8.33, (C) 16.7, (D) 25, (E) 33.3, and (F) 41.7 µg·mL−1 of PAD-5-1. PAD-5-1, p(AAPBA-b-DEGMA) (pAAPBA:DEGMA =1:5).
Abbreviations: DEGMA, diethylene glycol methyl ether methacrylate; NP, nanoparticle; p(AAPBA), poly(3-acrylamidophenylboronic acid).
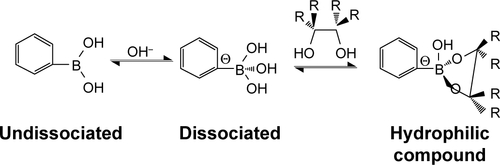
Scheme S1 The reaction between PBA and glucose.
Abbreviation: PBA, phenylboronic acid.
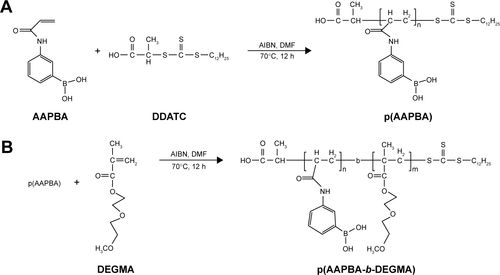
Scheme S2 The synthesis of p(AAPBA) and p(AAPBA-b-DEGMA) by RAFT polymerization.
Notes: (A) Synthesis of p(AAPBA); (B) synthesis of p(AAPBA-b-DEGMA).
Abbreviations: AIBN, 2,2-azo-bis-isobutyronitrile; DDATC, S-1-dodecyl-S′-(α,α′,-dimethyl-α″-acetic acid) trithiocarbonate; DEGMA, diethylene glycol methyl ether methacrylate; DMF, dimethyl formamide; p(AAPBA), poly(3-acrylamidophenylboronic acid); RAFT, reversible addition–fragmentation chain transfer.
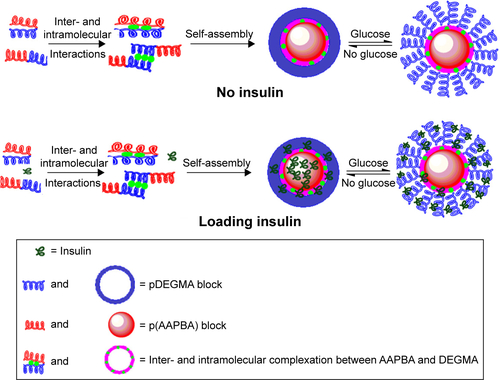
Scheme S3 A schematic illustrating self-assembly of the block copolymers into nanoparticles in aqueous solution, with and without insulin and glucose.
Abbreviations: DEGMA, diethylene glycol methyl ether methacrylate; p(AAPBA), poly(3-acrylamidophenylboronic acid).