
Figures & data
Figure 1 A synergistic anti-tumor effect of α-TOS and 2-DG was observed in vitro.
Notes: HT29, HeLa and A549 tumor cells were treated with α-TOS, 2-DG alone or α-TOS plus 2-DG. The dose-dependent growth of tumor cells was tested by MTT assay in (A) and time-dependent growth in (B). The death of tumor cells was confirmed by flow cytometry in (C), and the proliferation of tumor cells was detected by clone forming assay in (D). Data points represent the mean ± SD of three separate experiments (n=3), each performed in triplicate. *P<0.05 compared with α-TOS or 2-DG treatment alone.
Abbreviations: α-TOS, α-tocopheryl succinate; 2-DG, 2-deoxy-d-glucose; MTT, 3-(4,5-dimethylthiazolyl-2)-2,5-diphenyltetrazolium bromide; PI, propidium iodide.
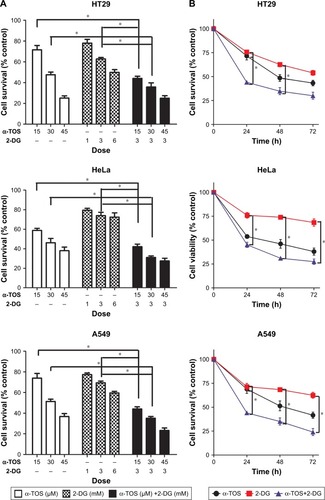
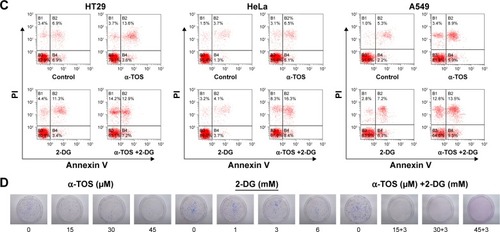
Table 1 Summary of TDF NPs EE and DLC
Figure 2 The synthesis and characterization of TDF NPs.
Notes: Drug release from TDF NPs was measured by a dialysis method in (A); (B) TEM image, (C) size distribution and (D) zeta potential of TDF NPs.
Abbreviations: α-TOS, α-tocopheryl succinate; 2-DG, 2-deoxy-d-glucose; TDF NPs, α-TOS-2-DG-loaded and folate receptor-targeted nanoparticles; TEM, transmission electron microscope; TD NPs, 2-DG- and α-TOS-loaded CStSa micelles without FA-BSA grated.
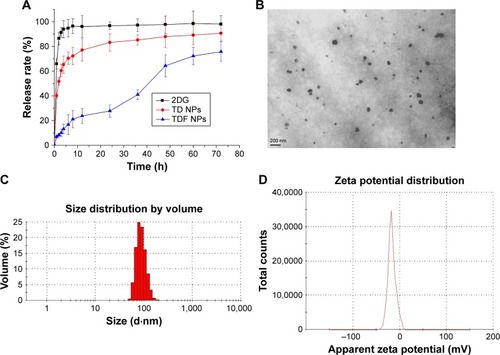
Figure 3 In vitro TDF NPs cellular function and behavior.
Notes: The effects of TDF NPs on the growth of tumor cells in (A); cellular uptake behavior of TDF NPs (B). Data points represent the mean ± SD of three separate experiments (n=3), each performed in triplicate. *P<0.05 compared with F NPs (blank nanocontrol). Scale bar 50 μm; magnification ×200.
Abbreviations: α-TOS, α-tocopheryl succinate; 2-DG, 2-deoxy-d-glucose; TDF NPs, α-TOS-2-DG-loaded and folate receptor-targeted nanoparticles; F NPs, BSA-FA grafted nanoparticles without drug loaded; BSA, bovine serum albumin; FA, folate acid; NS, no significance.
Figure 4 In vivo distribution of TDF NPs in tumor-bearing mice.
Notes: Fluorescence images of DiR-loaded nanoparticles in vivo. HeLa tumor-bearing nude mouse was injected free DiR dye or D-NPs intravenously. In vivo DiR fluorescence images of the mice at three time points 24 h, 48 h and 72 h were shown. The sites of tumors were indicated by yellow circles.
Abbreviations: D-NPs, DiR-loaded nanoparticles; α-TOS, α-tocopheryl succinate; 2-DG, 2-deoxy-d-glucose; TDF NPs, α-TOS-2-DG-loaded and folate receptor-targeted nanoparticles.
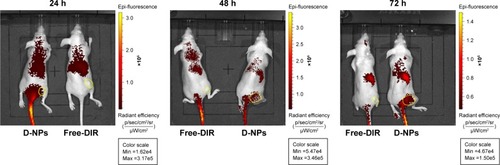
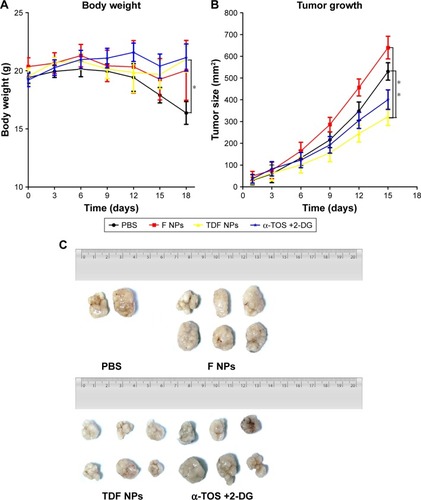
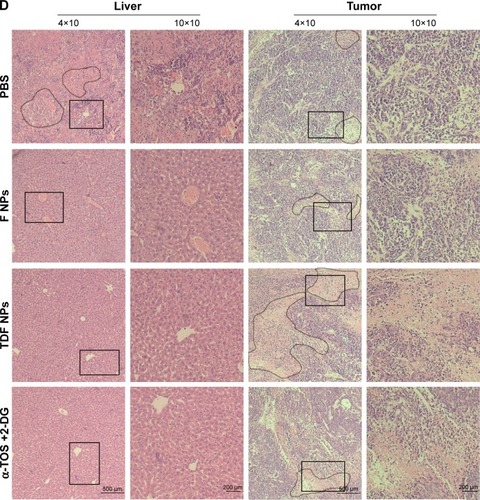
Figure 5 In vivo tumor suppression effects of TDF NPs.
Notes: (A) The body weight curves of tumor-bearing mice treated with PBS, nanocontrol, TDF NPs and a combination of α-TOS and 2-DG, respectively; (B) the tumor growth curves, (C) tumors and (D) pathological section images of the tumor and liver tissue. Circles indicated necrosis region, and rectangle indicated the 10×10 zoom region. *P<0.05 compared with PBS or F NPs treatment (nanocontrol). The 4×10 magnification scale bar 500 μm; 10×10 magnification scale bar 200 μm.
Abbreviations: TDF NPs, α-TOS-2-DG-loaded and folate receptor-targeted nanoparticles; F NPs, BSA-FA grafted nanoparticles without drug loaded; PBS, phosphate buffer saline; α-TOS, α-tocopheryl succinate; 2-DG, 2-deoxy-d-glucose.
Scheme 1 Schematic representation of the assembling process of TDF NPs.
Note: The process of TDF NP synthesis was schematically represented.
Abbreviations: α-TOS, α-tocopheryl succinate; 2-DG, 2-deoxy-d-glucose; TDF NPs, α-TOS-2-DG-loaded and folate receptor-targeted nanoparticles; (+StSa), cationic amphiphilic starch; BSA, bovine serum albumin; FA, folate acid; FR, folate receptor.
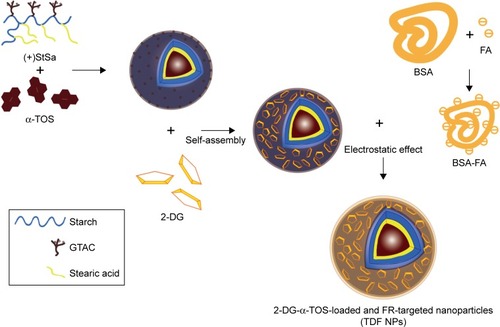
Figure S1 The 1H-NMR result of BSA-FA.
Note: As shown by the 1H-NMR spectra of BSA-FA dissolved in DMSO-d6, peaks assignment for the BSA and FA were straightforward, where the peaks at 6.5–8.5 ppm from FA.
Abbreviations: BSA, bovine serum albumin; FA, folate acid; ppm, parts per million.
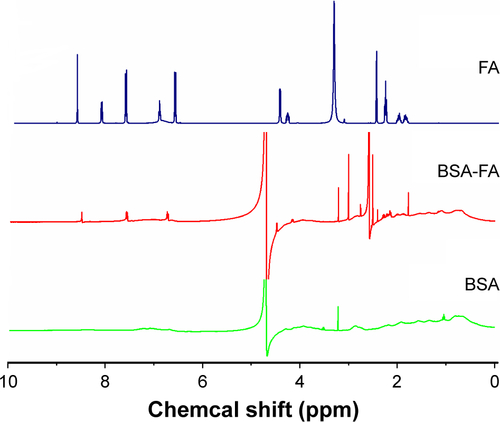
Figure S2 FR expression in HT29, HeLa and A549 tumor cell lines.
Abbreviation: FR, folate receptor.
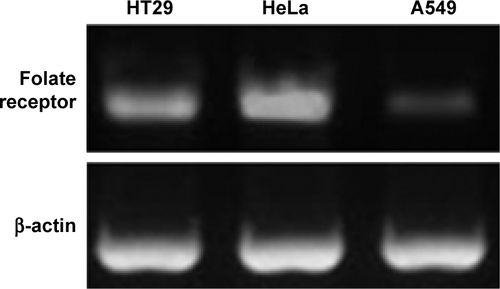
Table S1 LC50 values of α-TOS for apoptosis in tumor cell lines