Figures & data
Table 1 Experimental runs, independent variables and measured responses of the Box–Behnken model for tenoxicam nanostructured formulations
Figure 1 Response surface plots for the effects of the independent variables on the PS (A), ZP (B), EE (C) and GT (D) of the prepared nanostructured formulations.
Abbreviations: conc, concentration; EE, entrapment efficiency; GT, gelation temperature; GTP, glyceryl tripalmitate; PS, particle size; ZP, zeta potential.
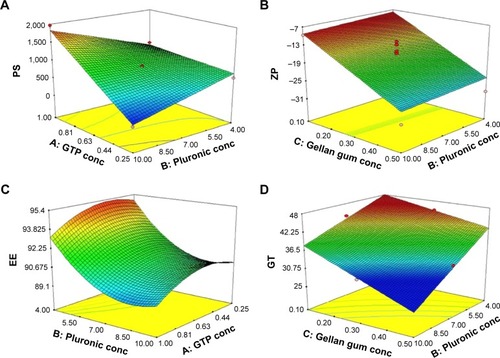
Table 2 Physical characteristics of the optimized formulations
Figure 2 Desirability values for the development of OIG (A and B) and PRE-I (C and D) formulations.
Abbreviations: conc, concentration; GTP, glyceryl tripalmitate; OIG, optimized in situ gel; PRE-I, pre-insert.
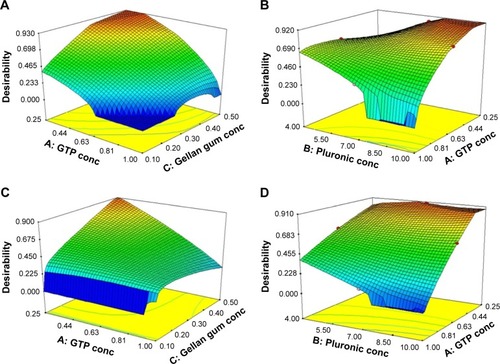
Figure 3 Characteristics of the lyophilized formulations, compared to the original nanostructured formulation (PRE-I).
Abbreviations: EE, entrapment efficiency; PRE-I, pre-insert; PS, particle size; ZP, zeta potential.
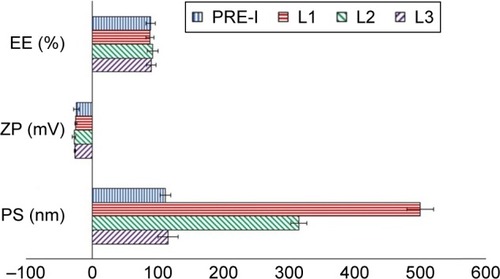
Figure 4 Transmission electron micrographs of the OIG formula at different magnifications.
Abbreviation: OIG, optimized in situ gel.
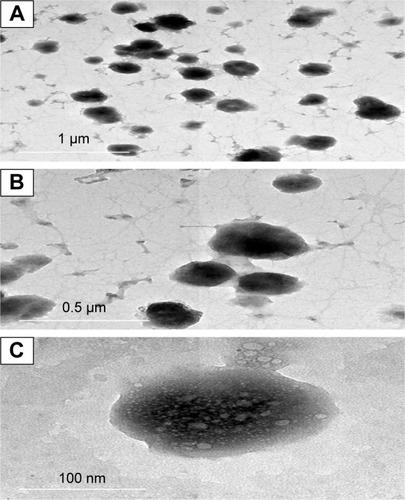
Figure 5 Scanning electron micrographs of the selected lyophilized formula (L3) at magnifications of 60× (A), 140× (B) and 800× (C).
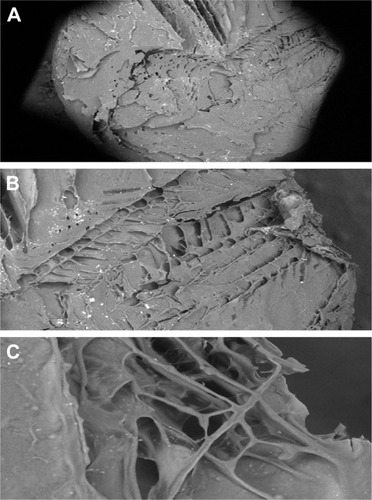
Figure 6 Rheological characteristics of the optimized formulations, including the changes in shear stress (A) or viscosity (B) with increasing rate of shear.
Abbreviations: OIG, optimized in situ gel; L3, selected lyophilized formula.
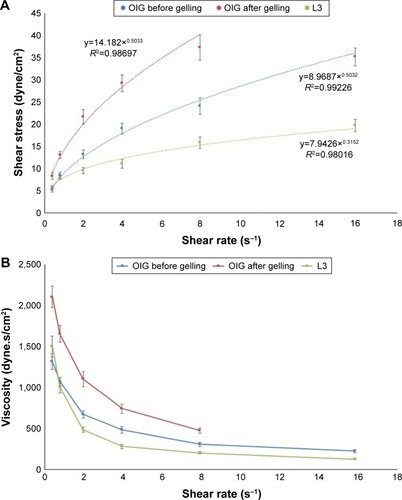
Figure 7 In vitro drug release from the optimized formulations, compared to the drug solution.
Abbreviations: OIG, optimized in situ gel; L3, selected lyophilized formula.
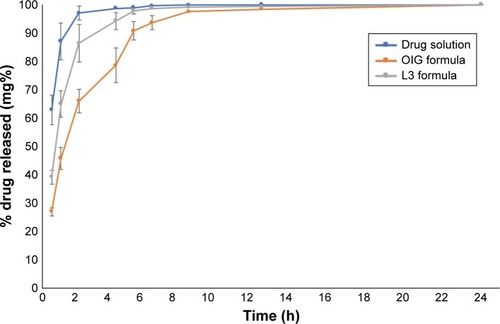
Figure 8 Ex vivo drug permeation from the optimized formulations, compared to the drug solution.
Abbreviations: OIG, optimized in situ gel; P2, the diffusion; J, flux; P1, partition; KP, permeability; TL, the lag time; L3, selected lyophilized formula.
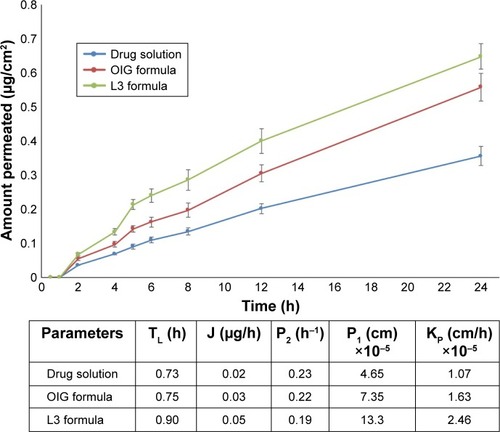
Figure 9 Histopathologic evaluation of the rabbit corneas after instillation of normal saline solution (A), OIG (B) and L3 (C) formulations.
Abbreviations: OIG, optimized in situ gel; L3, selected lyophilized formula.
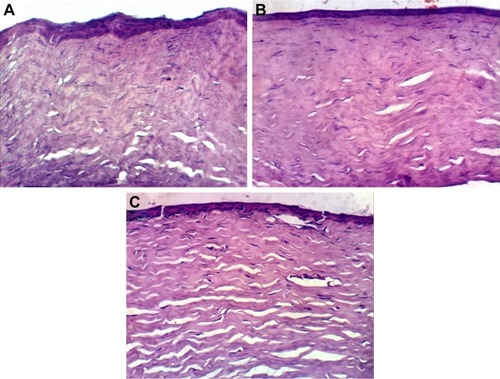
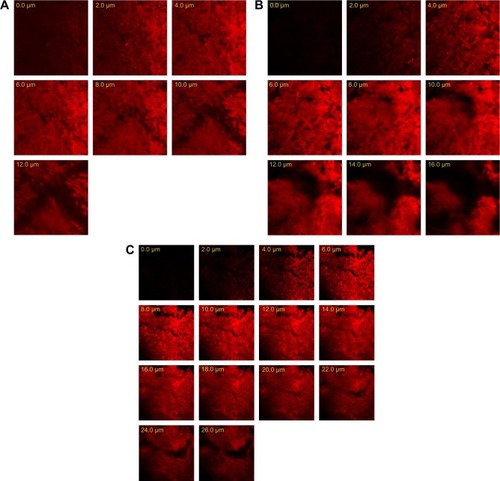
Figure 10 Confocal laser scanning micrographs of the rabbit corneas after instillation of RhB loaded in an aqueous solution (A), OIG (B) and L3 (C) formulations.
Abbreviations: OIG, optimized in situ gel; RhB, Rhodamine B; L3, selected lyophilized formula.